からだにいいもの
 Analysis in R: “DataEditR package for interactively editing data in RStudio
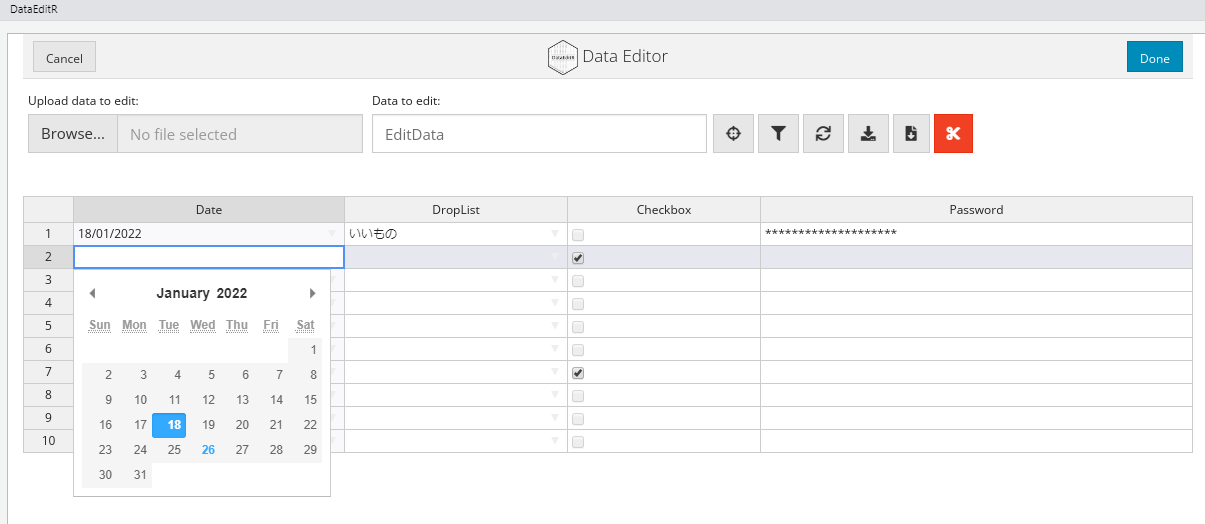
This is an introduction to a package that allows you to edit data interactively in RStudio. Note that by setting options, you can use the data entry methods “Choose a day from the calendar”, “Choose from a drop-down list”, “Check box”, and “Password expression”. The “This is also possible” section at the end of the Example command introduces these methods.
Edited data can be saved to CSV files or variables.
Package version is 0.1.4. Checked with R version 4.2.2.
<おすすめのRに関する書籍です>

生命科学・生物工学のための 間違いから学ぶ実践統計解析: R・Pythonによるデータ処理事始め (New paradigm! On-demand publishing)
よくある誤用や勘違いを起点に統計を学び直す一冊。R・Pythonの両方でデータ処理を扱う。
 www.amazon.co.jp
Install Package
Run the following command.
#Install Package
install.packages("DataEditR")
スポンサーリンク
Example
See the command and package help for details.
#Loading the library
library("DataEditR")

###Creating Data#####
#Install the tidyverse package if it is not already there
if(!require("tidyverse", quietly = TRUE)){
  install.packages("tidyverse");require("tidyverse")
}

set.seed(1234)
n <- 30
TestData <- tibble(Group = sample(paste0("Group", 1:4), n,
                                  replace = TRUE),
                   X_num_Data = sample(c(1:50), n, replace = TRUE),
                   Y_num_Data = sample(c(51:100), n, replace = TRUE),
                   Chr_Data = sample(c("か", "ら", "だ", "に",
                                       "い", "い", "も", "の"),
                                     n, replace = TRUE),
                   Fct_Data = factor(sample(c("か", "ら", "だ", "に",
                                              "い", "い", "も", "の"),
                                            n, replace = TRUE)))

#Check
TestData
# A tibble: 30 x 5
  Group  X_num_Data Y_num_Data Chr_Data Fct_Data
  <chr>       <int>      <int> <chr>    <fct>
1 Group4          3         67 の       に
2 Group4         36         58 に       に
3 Group2         31         92 か       だ
4 Group2         29         82 に       ら
5 Group1          5         97 も       に
6 Group4          2         72 に       い
7 Group3         47         85 だ       ら
8 Group1         40         91 か       い
9 Group1         20         66 い       い
10 Group2         48         53 い       か
# ... with 20 more rows
#######

#Edit data interactively in Rstudio: data_edit command
#Changed the first line of Chr_Data to "AAAAAAA"
#After changing data, click "synchronise" in the dialog
#Save the results in CSV in the working folder: save_as option
data_edit(TestData, save_as = "TestData.csv",
          write_fun = "write.table",
          write_args = list(sep = ",",
                            row.names = FALSE)) -> ChangeTestData

#Check
tibble(ChangeTestData)
# A tibble: 30 x 5
  Group  X_num_Data Y_num_Data Chr_Data         Fct_Data
  <chr>       <int>      <int> <chr>            <chr>
1 Group4          3         67 AAAAAAA          に
2 Group4         36         58 に               に
3 Group2         31         92 か               だ
4 Group2         29         82 に               ら
5 Group1          5         97 も               に
6 Group4          2         72 に               い
7 Group3         47         85 だ               ら
8 Group1         40         91 か               い
9 Group1         20         66 い               い
10 Group2         48         53 い               か
# ... with 20 more rows

###This is also possible#####
EditData <- tibble("Date" = rep("", 10),
                   "DropList" = rep("", 10),
                   "Checkbox" = rep("", 10),
                   "Password" = rep("", 10))

data_edit(EditData,
          col_options = list(Date = "date",
                             DropList = c("からだに", "いいもの"),
                             Checkbox = c(TRUE,FALSE),
                             Password = "password"),
          col_stretch = TRUE)
Dialog displayed after executing “This is also possible”
I hope this makes your analysis a little easier !!
スポンサーリンク