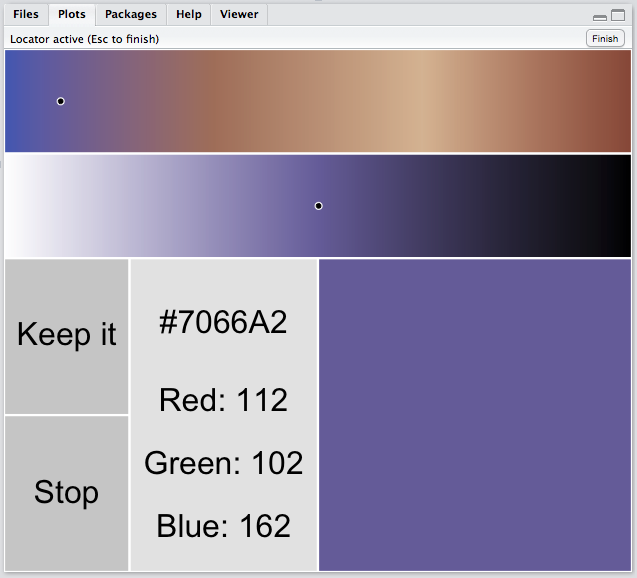
グラフ描写に役に立つコマンドが収録されたパッケージかと思いましたが、内容を確認すると「インタラクティブにカラーパレットからカラーコードを取得できる」pickColorsコマンドが収録されていることに気がつきました。
pickColorsコマンド、大変便利だと思います。その他、矢印やドーナツプロット、円の描写の便利なのでぜひ試していただきたいパッケージです。plot0コマンド知りませんでした。
パッケージバージョンは1.1-0。実行コマンドはR version 3.2.2で確認しています。
パッケージのインストール
下記、コマンドを実行してください。
#パッケージのインストール
install.packages("devtools")
library("devtools")
install_github("KevCaz/graphicsutils")
実行コマンド
詳細はコメント、パッケージのヘルプを確認してください。
#パッケージの読み込み
library("graphicsutils")

#インタラクティブにカラーコードを取得:pickColorsコマンド
#scalesパッケージは下記を参照
#https://www.karada-good.net/analyticsr/r-109/
library("scales")
x <- seq(0, 1, length = 1024)
RampVec <- seq_gradient_pal(c("#4b61ba", "#a87963", "#d9bb9c"))(x)
pickColors(ramp = RampVec, nb_shades = 1024)

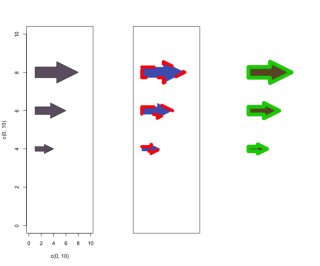
#矢印の描写:arrows2コマンド
par(mfrow = c(1, 3))
plot(c(0, 10), c(0, 10), type = "n")
arrows2(1, c(4, 6, 8), x1 = c(4, 6, 8), y1 = c(4, 6, 8),
        col = "#6e5f72", border = 1, lty = 1, lwd = 1,
        cex.hg = 1, cex.hh = 1, cex.sk = 1, pct.hw = .5)
plot(c(0, 10), c(0, 10), type = "n", axes = FALSE, xlab = "", ylab = "")
box()
arrows2(1, c(4, 6, 8), x1 = c(4, 6, 8), y1 = c(4, 6, 8),
        col = "#4b61ba", border = 2, lty = 2, lwd = 8,
        cex.hg = 1, cex.hh = 1, cex.sk = 1, pct.hw = .5)
plot0(c(0, 10), c(0, 10))
arrows2(1, c(4, 6, 8), x1 = c(4, 6, 8), y1 = c(4, 6, 8),
        col = "#685432", border = 3, lty = 1, lwd = 10,
        cex.hg = 1, cex.hh = 1, cex.sk = 1, pct.hw = .5)

#円の描写:circleコマンド
plot0(x = c(-2, 2), y = c(-2, 2), asp = 1)
circle(x = c(-1, 1), c(1, 1, -1, -1), from = pi*seq(0.25, 1, by = 0.25),
       to = 1.25*pi, col = "#4b61ba", border = "#a87963", lwd = 14)
#追加
circle(x = 0, radi = 1.3, from = 0.5*pi, to = 0.25*pi, col = "#d9bb9c", border = NULL)

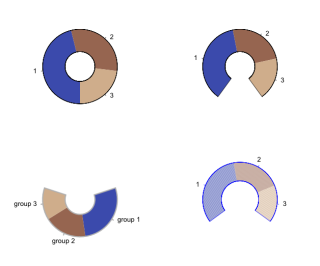
#ドーナツチャートの作成:donutコマンド
par(mfrow = c(2, 2), mar = rep(2, 4))
donut(c(30, 20, 15), mycol = c("#4b61ba", "#a87963", "#d9bb9c"))
donut(c(30, 20, 15), eaten = 0.2, mycol = c("#4b61ba", "#a87963", "#d9bb9c"))
donut(c(30, 20, 15), eaten = 0.4, rot = 180, labels = paste("group", 1:3),
      lwd = 3, col = 8, mycol = c("#4b61ba", "#a87963", "#d9bb9c"))
donut(c(30, 20, 15), eaten = 0.3, cx = 1, col = 4, width = .5,
      mycol = c("#4b61ba", "#a87963", "#d9bb9c"), density = 50, angle = c(20, 55, 110))

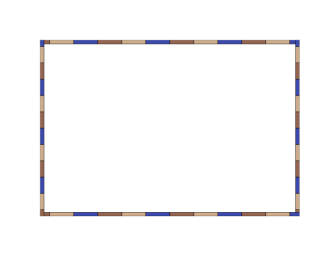
#プロット領域の枠を描写:frameitコマンド
plot0()
frameit(cex.x = 1.5, col = c("#4b61ba", "#a87963", "#d9bb9c"), border = 1)

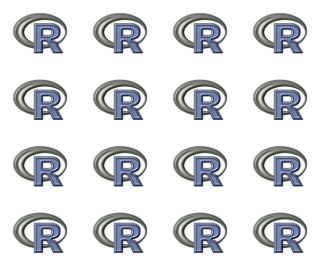
#画像ファイルのプロット:plotImageコマンド
img <- png::readPNG(system.file("img", "Rlogo.png", package = "png"), native = TRUE)
op <- par(no.readonly = TRUE)
par(mfrow = c(4, 4), mar = rep(2, 4))
for (i in 1:16) plotImage(img)
par(op)
出力例
pickColorsコマンドをぜひ実行して、インタラクティブな体験をどうぞ。
・pickColorsコマンド
・arrows2コマンド
・circleコマンド

・donutコマンド
・frameitコマンド
・plotImageコマンド
少しでも、あなたのウェブや実験の解析が楽になりますように!!

