plotコマンドで出力した図の軸をラクラクに装飾できる「magicaxisパッケージ」を紹介します。Rの「グラフィックスパラメータ」で発展的な図を作成できますが、慣れないとなかなか難しいものです。magicaxisパッケージでは直感的に軸の装飾などの作業ができます。ぜひ、試してみてください。
グラフィックスパラメータの概要に興味がある方は下記の記事がオススメです。
・頻度が高い?20のグラフィックスパラメータのまとめ
パッケージのバージョンは2.2.14。実行コマンドはR version 4.2.2で確認しています。
パッケージのインストール
下記コマンドを実行してください。
#パッケージのインストール
install.packages("magicaxis")
実行コマンド
詳細はコメントまたはパッケージヘルプを確認してください。
#パッケージの読み込み
library("magicaxis")
###データ例の作成#####
TestData <- data.frame(Group = paste0("TEST", 1:100),
Data1 = sample(1:500, 100),
Data2 = sample(200:300, 100))
####
#軸の体裁を調整する:magaxisコマンド
#軸の調整;sideオプション:1 = bottom, 2 = left, 3 = top, 4 = right
#主メモリの分割設定;majorn, 長さ;tcl
#副メモリの分割設定;minorn, 長さ;ratio
#軸を低10のlogに変換;unlogオプション:"x", "y", "xy" or "yx" or "Auto"
#各軸名ラベルの距離;mtline
#軸ラベルをべき乗表示;crunch: TRUE of FALSE
#目盛間隔を指定;prettybase
#macでの日本語文字化け防止
#par(family = "HiraKakuProN-W3")
#ベースとなる図をプロット
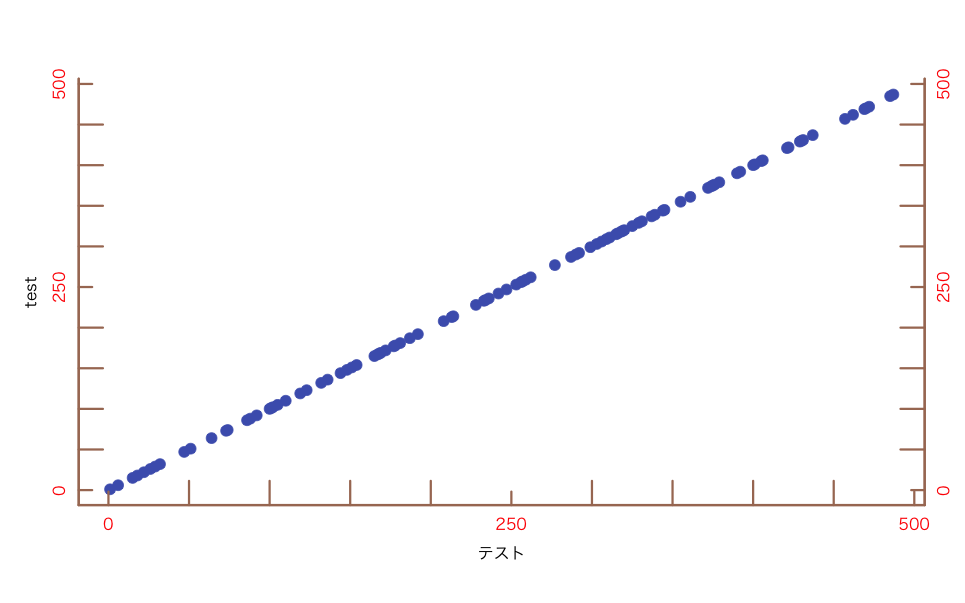
plot(TestData[, 2], TestData[, 2], pch = 19, col = "#4b61ba",
cex = 1.5, axes = FALSE, xlab = "", ylab = "")
#軸をプロット
magaxis(side = c(1, 2, 4), majorn = 3, minorn = 3, tcl = 0.7, ratio = 1.8, labels = TRUE,
unlog = "Auto", mgp = c(2, 0.5, 0), mtline = 2, xlab = "テスト", ylab = "test",
crunch = TRUE, prettybase = 50, family = "HiraKakuProN-W3", col = "#a87963",
col.axis = "red", lwd = 3)
####
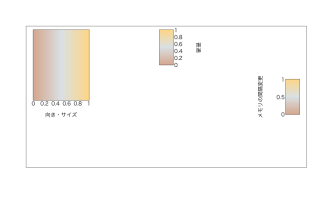
#バーラベルを図に追加:magbarコマンド
#ラベルメモリの間隔変更:labNオプション
#向きとサイズの変更:orientとscaleオプション
#macでの日本語文字化け防止
par(family = "HiraKakuProN-W3")
#ベースとなる図をプロット
plot(TestData[, 2], TestData[, 2], type = "n", axes = FALSE, xlab = "", ylab = "")
box()
#色を設定
ColBar <-colorRampPalette(c("#deb7a0", "#e1e6ea", "#ffdd99"))
#バーラベルをプロット
magbar("top", title = "普通", titleshift = 0.8, col = ColBar(100))
#メモリ間隔を変更
magbar("right", title = "メモリの間隔変更", labN = 3,
titleshift = 0.8, col = ColBar(100))
#向きを変更
magbar("topleft", orient = "h", title = "向き・サイズ", titleshift = 1,
col = ColBar(100), scale = c(0.2, 0.5))
####
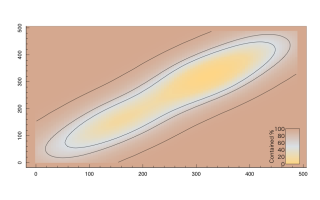
#データ分布をヒートマップで表示:magconコマンド
#色の設定
ColBar <-colorRampPalette(c("#deb7a0", "#e1e6ea", "#ffdd99"))
#プロット
magcon(TestData[, 2], TestData[, 2],
imcol = ColBar(100), barposition = "bottomright")出力例
・magaxisコマンド
・magbarコマンド
・magconコマンド
少しでも、あなたの解析が楽になりますように!!

