からだにいいもの
 Rで解析:川の流れのようにデータをプロット!「riverplot」パッケージの紹介
ウェブページの遷移だけでなく時間の変化・つながりを表現する方法にriverプロットという表現方法があります。riverプロットを作成できる「riverplot」パッケージを紹介します。
表現方法として非常に面白いと思います。
パッケージバージョンは0.10です。 実行コマンドはwindows 11のR version 4.1.2で確認しています。


パッケージのインストール
下記コマンドを実行してください。
#パッケージのインストール
install.packages("riverplot")
スポンサーリンク
実行コマンドの紹介
詳細はコマンド、パッケージヘルプを確認してください。
#ライブラリの読み込み
library("riverplot")

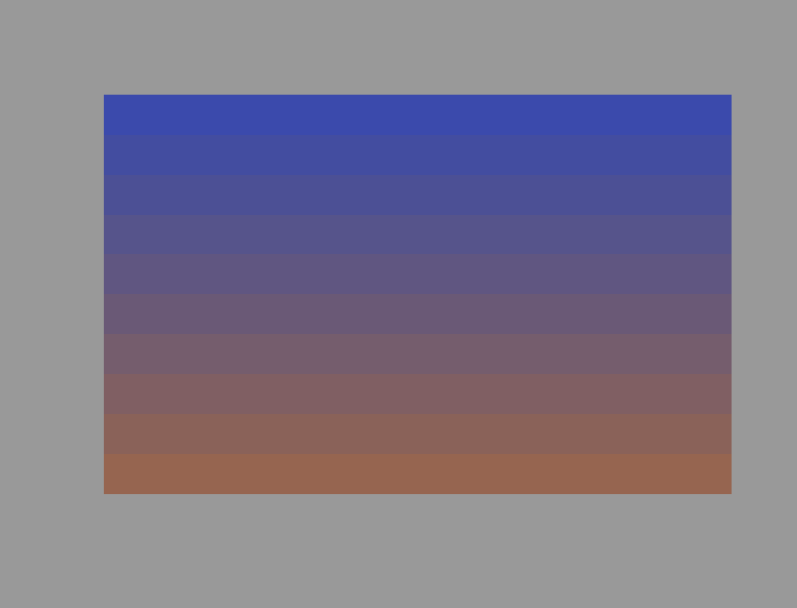
#2色を指定し補色のカラーパレットを作成:ColRampPaletteコマンド
ColRampPalette <- colorRampPaletteAlpha(c("#4b61ba", "#a87963"))(10)
#カラーパレットのプロット
#軸範囲:x:0-2, y:0-2
#プロット背景色を指定
par(bg = "#A9A9A9")
#図の描写
plot(0:2, 0:2, type = "n", axes = FALSE, xlab = "", ylab = "")
rasterImage(as.raster(ColRampPalette), 0, 2, 2, 0, interpolate = FALSE)

#帯状のラインを既存のプロットに追加:curvesegコマンド
#curveseg(x0 = x軸開始点, x1 = x軸終了点, y0 = y軸開始点, y1 = y軸終了点,
#         width = 帯の太さ, col = 色, lty = 枠線の太さ, form = "sin" or "line")
#ColRampPaletteコマンドで出力した図に追加
#form:sin
curveseg(x0 = 0, x1 = 1, y0 = 1, y1 = 0, width = 0.3,
         col= "#deb7a0", lty = 0, form = "sin")
#form:line
curveseg(x0 = 1, x1 = 2, y0 = 0, y1 = 1.7, width = 2 - 1.7,
         col= "#ffdd99", lty = 0, form = "line")

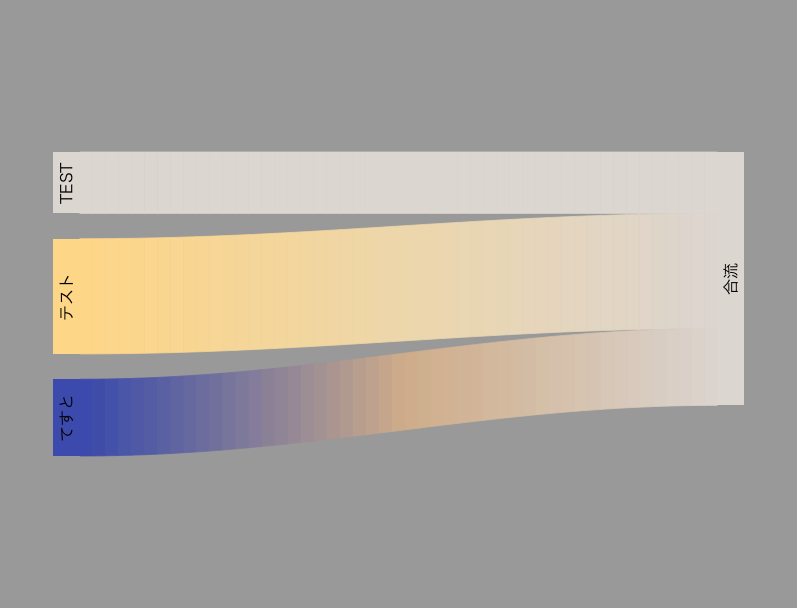
#リバープロット:makeRiverコマンド
#英語大文字でnodesとlistでedges(角リボンの幅)を設定
nodes <- c(LETTERS[1:4])
edges <- list(A = list(D = 10), B = list(D = 15), C = list(D = 8))
RiverData <- makeRiver(nodes, edges, node_xpos = c(1, 1, 1, 2),
                       node_labels = c(A = "てすと", B = "テスト",
                                       C = "TEST", D = "合流"),
                       node_styles = list(A = list(col = c("#4b61ba","#d9bb9c")),
                                          B = list(col = "#ffdd99")))
#MAC日本語文字化け防止
#par(family = "HiraKakuProN-W3")
#プロット背景色を指定
par(bg = "#A9A9A9")
#図の描写
plot(RiverData)

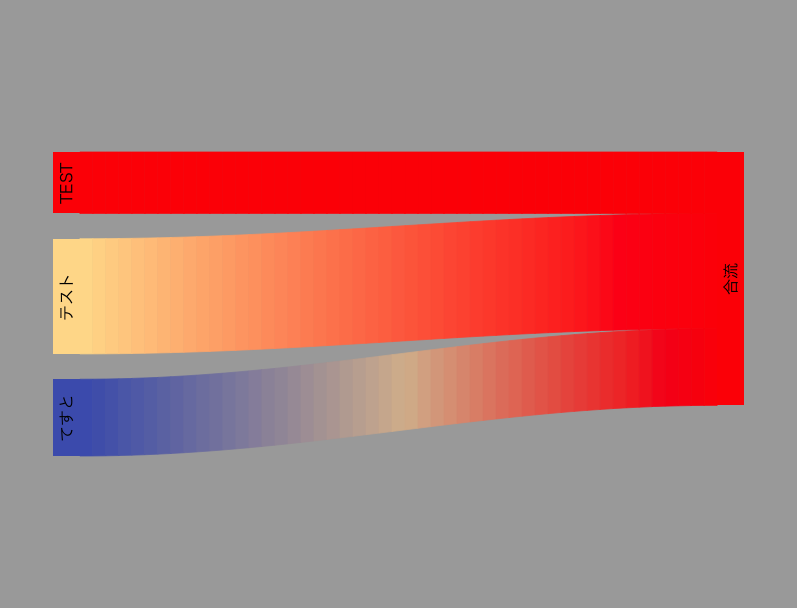
#リバープロットのディフォルトの色(グレー)を変更:default.styleコマンド
ds <- default.style()
ds[["col"]] <- "red"
#プロット背景色を指定
par(bg = "#A9A9A9")
#図の描写
plot(RiverData, default_style= ds)

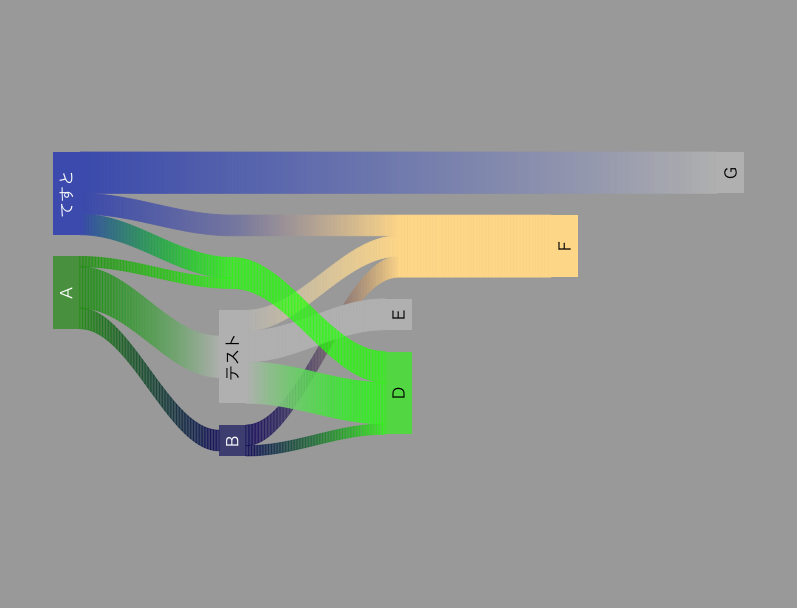
#参考:riverplot.exampleに使用されているコマンドを紹介
#色とラベルの一部を変更しています
#データの作成
ret <- list(nodes = data.frame(ID = LETTERS[1:8], x = c(1, 2, 2, 3, 3, 4, 5, 1),
                               labels = c(NA, NA, "テスト", rep(NA, 4), "てすと"),
                               stringsAsFactors = FALSE),
            styles = list(A = list(col = "#00990099", lty = 0, textcol = "white"),
                          H = list(col = "#4b61ba", textcol = "white"),
                          B = list(col = "#00006699", textcol = "white"),
                          F = list(col = "#ffdd99"), D = list(col = "#00FF0099")))

ret$edges <- data.frame(N1 = c("A", "A", "A", "H", "H", "H", "B", "B", "C", "C", "C"),
                        N2 = c("B", "C", "D", "D", "F", "G", "D", "F", "D", "E", "F"),
                        Value = c(10, 20, 5, 10, 10, 20, 5, 10, 20, 15, 10), stringsAsFactors = F)
rownames(ret$nodes) <- ret$nodes$ID

#作成したデータをriverplotに対応するようにデータを変換
class(ret) <- c(class(ret), "riverplot")

#MAC日本語文字化け防止
#par(family = "HiraKakuProN-W3")
#プロット背景色を指定
par(bg = "#A9A9A9")
#図の描写
plot(ret)
出力例
・ColRampPaletteコマンド
・curvesegコマンド(帯状のラインを既存のプロットに追加)
ColRampPaletteコマンドで出力した図に追加しています。

・makeRiverコマンド
・default.styleコマンド
・riverplot.exampleに使用されているコマンド
少しでも、あなたの解析が楽になりますように!!

スポンサーリンク