画像のプロットに便利なパッケージの紹介です。プロットだけでなく画像の輝度やRGBの情報も取得できるので便利です。記事では最低限な使用方法を紹介しています。他の利用方法はオフィシャルサイトを確認していただければと思います。
参考画像として、劇場版「響け!ユーフォニアム~北宇治高校吹奏楽部へようこそ~」が大変素晴らしかったので、ブルーレイより第8話のシーンを利用しています。ゴールデンウィークが暇ならオススメの映画です。
・「imager」パッケージのオフィシャルサイト
https://cran.r-project.org/web/packages/imager/vignettes/gettingstarted.html
・劇場版「響け!ユーフォニアム~北宇治高校吹奏楽部へようこそ~」サイト
http://anime-eupho.com/
パッケージバージョンは0.42.16。実行コマンドはwindows 7およびOS X 10.11.2のR version 3.2.3で確認しています。
パッケージのインストール
下記コマンドを実行してください。
#パッケージのインストール
install.packages("imager")
実行コマンドの紹介
詳細はコマンド内を確認ください。
#パッケージの読み込み
library("imager")
#画像ファイルの読み込み
#install.packages("tcltk")
library("tcltk")
#ファイルを選択
PictPath <- paste0(as.character(tkgetOpenFile(title = "画像ファイルを選択",
filetypes = '{"画像ファイル" {".*"}}',
initialfile = "*.*")))
#指定したファイルを読み込み:load.imageコマンド
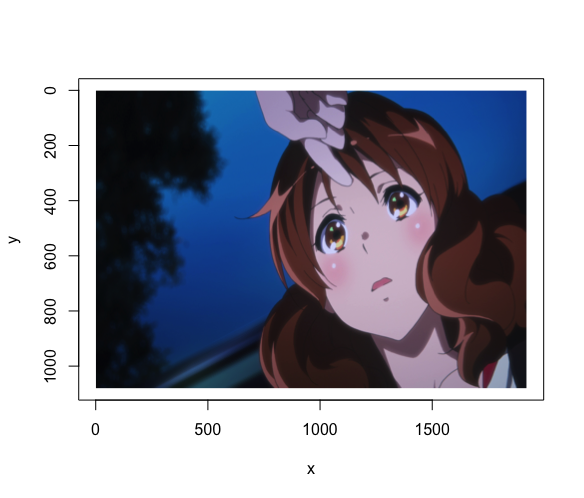
PlotPic <- load.image(PictPath)
#内容をプロット
plot(PlotPic)
###参考:ggplot2パッケージでプロット#####
GGplotData <- as.data.frame(PlotPic, wide = "c")
#「plyr」パッケージで処理
GGplotData <- mutate(GGplotData, rgb.val = rgb(c.1, c.2, c.3))
#プロット
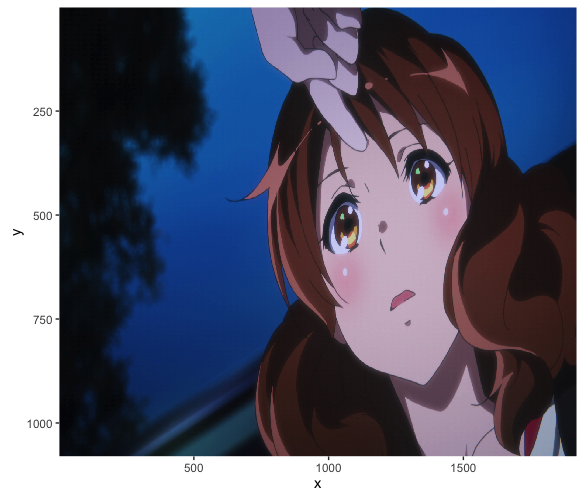
ggplot(GGplotData, aes(x, y)) + geom_raster(aes(fill = rgb.val)) +
scale_fill_identity() + scale_y_reverse(expand = c(0, 0)) +
scale_x_continuous(expand = c(0, 0))
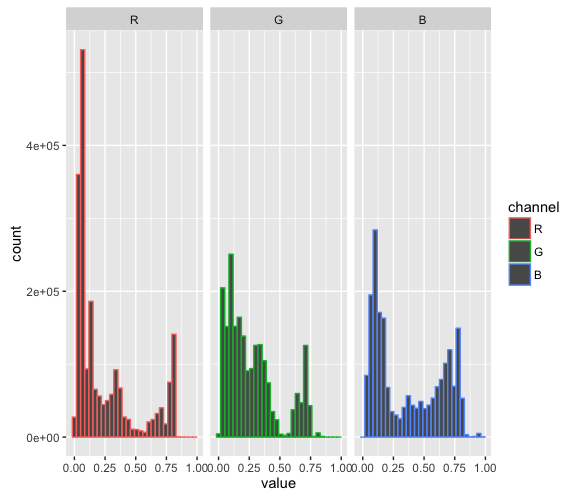
#RGBの情報をプロット
#必要なライブラリを読み込み
#必要に応じてインストールしてください
#install.packages(c("ggplot2", "plyr"))
library("ggplot2")
library("plyr")
#プロットデータの準備
PlotPicData <- as.data.frame(PlotPic)
#「plyr」パッケージで処理
PlotData <- mutate(PlotPicData, channel = factor(cc, labels = c("R", "G", "B")))
#ggplotでプロット
ggplot(PlotData, aes(value, col = channel)) +
geom_histogram(bins = 30) + facet_wrap(~channel)
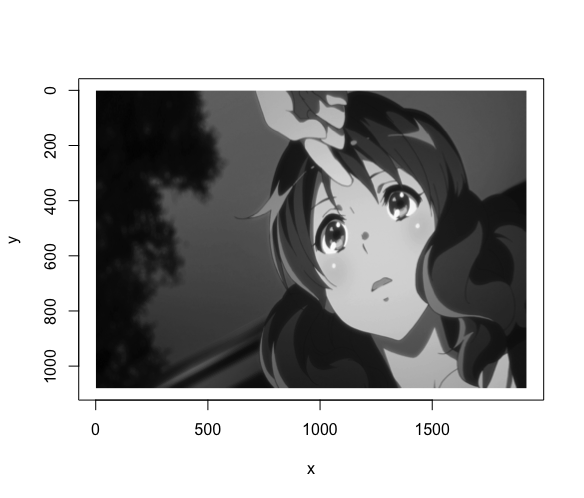
#ファイルをグレースケールでプロット:grayscaleコマンド
GrayPlotPic <- grayscale(PlotPic)
#内容をプロット
plot(GrayPlotPic)
#画像の輝度の情報をプロット
hist(GrayPlotPic, main = "Luminance")出力例
・load.imageコマンド
・load.imageコマンド;ggplot2を利用
・RGBの情報をプロット
・grayscaleコマンド
少しでも、あなたのウェブや実験の解析が楽になりますように!!