データのインタラクティブな探索だけでなく、コマンドによるデータ探索、決定木の作成、ランダムフォレスト、勾配ブースティング回帰木(XGBoost)やロジスティク回帰などの分析、サンプルデータとカラーパレットの作成に便利なパッケージの紹介です。
パッケージバージョンは1.3.1。実行コマンドはwindows 11のR version 4.3.3で確認しています。
紹介動画
パッケージのインストール
下記コマンドを実行してください。
# パッケージのインストール
install.packages("explore")
コマンドの紹介
詳細はコマンド、パッケージのヘルプを確認してください。
# パッケージの読み込み
library("explore")

### データ内容の記述コマンド #####
# データ例の準備
Test_Data <- use_data_iris()


# データをインタラクティブに確認:exploreコマンド
explore(Test_Data)


# データの行列数,NA値情報を表示:describe_tblコマンド
# 合計値を表示:nオプション;初期値未設定
Test_Data |>
  describe_tbl()
# 150 observations with 5 variables
# 0 observations containing missings (NA)
# 0 variables containing missings (NA)
# 0 variables with no variance


# データの変数数,class数をプロット:explore_tblコマンド
Test_Data |>
  explore_tbl()

# データ内の全指標の情報をtibble classで返す:describe_allコマンド
# 返り値の内容を指定:outオプション;"small":variable,type,na,na_pct,初期値:"large"
Test_Data |>
  describe_all(out = "large")
# A tibble: 5 × 8
#  variable     type     na na_pct unique   min  mean   max
#  <chr>        <chr> <int>  <dbl>  <int> <dbl> <dbl> <dbl>
# 1 Sepal.Length dbl       0      0     35   4.3  5.84   7.9
# 2 Sepal.Width  dbl       0      0     23   2    3.06   4.4
# 3 Petal.Length dbl       0      0     43   1    3.76   6.9
# 4 Petal.Width  dbl       0      0     22   0.1  1.2    2.5
# 5 Species      fct       0      0      3  NA   NA     NA

# 例えばこんな使い方
Test_Data |>
  describe_all(out = "large") |>
  dplyr::filter(mean < 3.5)
#  A tibble: 2 × 8
#  variable    type     na na_pct unique   min  mean   max
#  <chr>       <chr> <int>  <dbl>  <int> <dbl> <dbl> <dbl>
#1 Sepal.Width dbl       0      0     23   2    3.06   4.4
#2 Petal.Width dbl       0      0     22   0.1  1.2    2.5


# データ内の全指標の情報をプロット:explore_allコマンド
# グループ別に表示:targetオプション;初期値:設定なし
Test_Data |>
  explore_all(target = Species)


# データ内の1指標の情報を返す:describeコマンド
Test_Data |>
  describe(var = Petal.Length)
# variable = Petal.Length
# type     = double
# na       = 0 of 150 (0%)
# unique   = 43
# min|max  = 1 | 6.9
# q05|q95  = 1.3 | 6.1
# q25|q75  = 1.6 | 5.1
# median   = 4.3
# mean     = 3.758
########


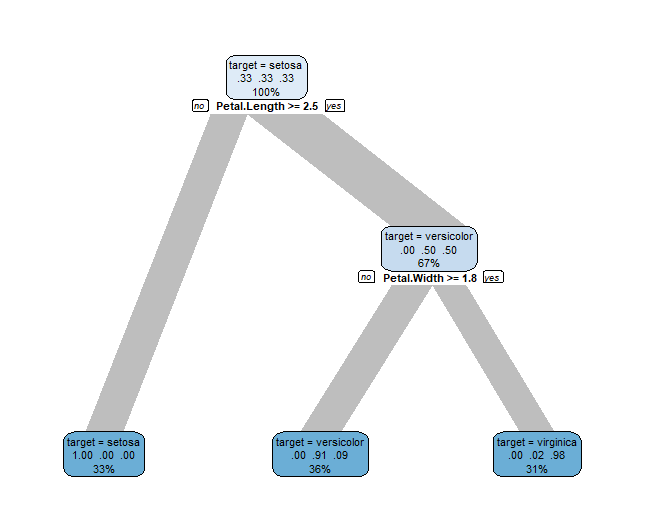
# 決定木を作成:explain_treeコマンド
# 従属変数を指定:targetオプション
# 使用する最大カテゴリ変数数:max_catオプション
# 従属変数に対して使用する最大カテゴリ変数数:max_target_catオプション
# 決定木の最大の深さを指定:maxdepthオプション
# 決定木の剪定(complex parameter):cpオプション;初期値:0
# 重み:weightsオプション;初期値:NA
# テキストサイズ:sizeオプション
Test_Data |>
  explain_tree(target = Species,
               max_cat = 10,
               max_target_cat = 5,
               maxdepth = 3,
               cp = 0, weights = NA,
               size = 0.7)


# ランダムフォレストを実行:explain_forestコマンド
# 「randomForest」パッケージがない場合,インストールするか質問されます
# Number of trees used for Random Forest:ntreeオプション;初期値:50
# 結果の出力:outオプション;"plot","model","importance", all";初期値;"plot"
Test_Data |>
  explain_forest(target = Species, ntree = 50, out = "all")


# 勾配ブースティング回帰木(XGBoost)を実行:explain_xgboostコマンド
# 「xgboost」パッケージがない場合,インストールするか質問されます
# 数値以外の変数は削除する必要があります,drop_var_not_numericコマンドの使用がおすすめです
Test_Data |>
  drop_var_not_numeric() |>
  # ランダムに0/1(binaryデータ)を追加:add_var_random_01コマンド
  add_var_random_01("binary", prob = c(0.5, 0.5)) |>
  explain_xgboost(target = binary, out = "all")


# ロジスティク回帰を実行:explain_logregコマンド
Test_Data |>
  explain_forest(target = Species, ntree = 50, out = "all")
########


### サンプルデータ生成コマンド #####
# 空のデータオブジェクトを作成:create_data_emptyコマンド
# サンプルサイズを指定:obsオプション;初期値:1000
# id列を付与:add_idオプション;TRUE/FALSE;初期値:FALSE
create_data_empty(obs = 10, add_id = FALSE)

# 例えばこんな使い方
create_data_empty(obs = 10, add_id = FALSE) |>
  # ランダムに0/1を追加:add_var_random_01コマンド
  add_var_random_01("初アクセス", prob = c(0.5, 0.5)) |>
  # ランダムに指定文字を追加:add_var_random_catコマンド
  add_var_random_cat(name = "からだにいいもの", cat = c("HP", "youtube")) |>
  # ランダムに数字を追加:add_var_random_intコマンド
  add_var_random_int(name = "年齢", min_val = 18, max_val = 100)
# # A tibble: 10 × 3
#    初アクセス からだにいいもの  年齢
#         <int> <chr>            <int>
#  1          0 HP                  30
#  2          0 HP                  72
#  3          0 HP                  89
#  4          0 HP                  90
#  5          0 HP                  88
#  6          0 HP                  55
#  7          1 HP                  82
#  8          0 youtube             61
#  9          0 HP                  89
# 10          0 HP                  37


# A/Bテストのサンプルデータ:create_data_abtestコマンド
# Aグループの総数を指定:n_aオプション;初期値:100
# Aグループのsuccess数を指定:success_aオプション;初期値:10
# Bグループの総数を指定:n_bオプション;初期値:100
# Bグループのsuccess数を指定:success_bオプション;初期値:5
# n列の表示設定:success_unitオプション:"count","percent"
# 集計データで表示する:countオプション:TRUE/FALSE
create_data_abtest(n_a = 200, success_a = 20,
                   n_b = 198, success_b = 20,
                   success_unit = "count",
                   count = TRUE)


# iOSやAndroidなどのアクセスデータ:create_data_appコマンド
# サンプルサイズを指定:obsオプション
# id列を付与:add_idオプション;TRUE/FALSE
# 乱数のシードを指定:seedオプション;初期値:123
create_data_app(obs = 1000, add_id = TRUE, seed = 123)

# 年齢や性別,通信量やデバイス情報などのネット環境を含むデータ:create_data_buyコマンド
# buy列名を変更する:target_nameオプション;初期値:"buy"
# buy列を因子化する:factorise_targetオプション;TRUE/FALSE:TRUEでYES/NO,FALSEで1/0
# buy列内の出現確立:target1_probオプション;初期値:0.5
# 外れ値(異常値, 極端な値)データを追加する:add_extremeオプション;TRUE/FALSE
# 性別を反転する:flip_genderオプション;TRUE/FALSE
# id列を追加する:add_idオプション;TRUE/FALSE
# 乱数のシードを指定:seedオプション;初期値:123
create_data_buy(obs = 1000,  target_name = "buy",
                factorise_target = TRUE,
                target1_prob = 0.5, add_extreme = TRUE,
                flip_gender = FALSE, add_id = TRUE, seed = 123)


### その他生成コマンド#####
create_data_churn()
create_data_esoteric()
create_data_newsletter()
create_data_person()
create_data_random()
create_data_unfair()
########

### パッケージ付属データの紹介 #####
# Rのirisデータ:use_data_irisコマンド
use_data_iris()

# Rのmtcarsデータ:use_data_mtcarsコマンド
use_data_mtcars()

# RのTitanicデータ:use_data_titanicコマンド
use_data_titanic(count = TRUE)

# 「palmerpenguins」パッケージのpalmerpenguinsデータ:use_data_penguinsコマンド
use_data_penguins()

# 「dplyr」パッケージのstarwarsデータ:use_data_starwarsコマンド
use_data_starwars()

# 「tibble」パッケージのbeerデータ:use_data_beerコマンド
use_data_beer()

# 「ggplot2」パッケージのdiamondsデータ:use_data_diamondsコマンド
use_data_diamonds()

# 「ggplot2」パッケージのmpgデータ:use_data_mpgコマンド
use_data_mpg()
########


### カラーパレットに関するコマンド #####
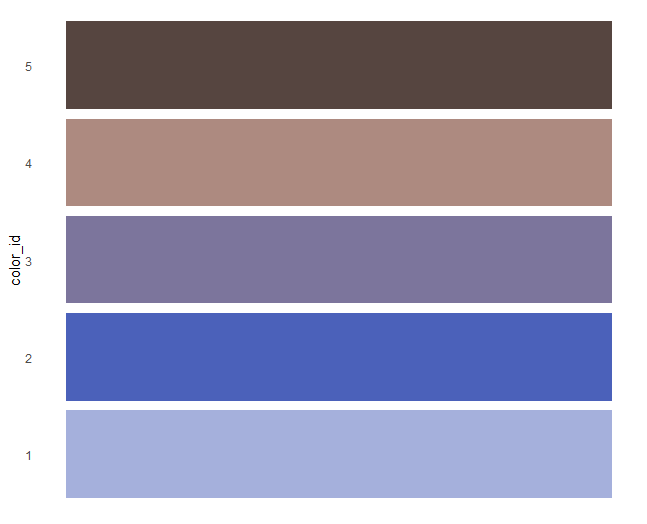
# 指定した色に基づきカラーパレットを作成:mix_colorコマンド
# 単色/2色で指定します
Get_Color <- mix_color(c("#4b61ba", "#ad8a80"), n = 5)
# カラーパレットを表示する:show_colorコマンド
show_color(Get_Color)

# パッケージ収録のカラーパレットを利用する:get_colorコマンド
# 収録内容を確認
get_color()
# カラーパレットを表示
show_color(get_color("ubuntu"))
出力例
・exploreコマンド

・explain_treeコマンド

・mix_colorコマンド

少しでも、あなたの解析が楽になりますように!!


