「ggplot2」パッケージ、もしくは「grid」パッケージの図形に13種類のパターンを塗(fill)で設定できるパッケージの紹介です。パータンの角度、線種、色は変更可能です。
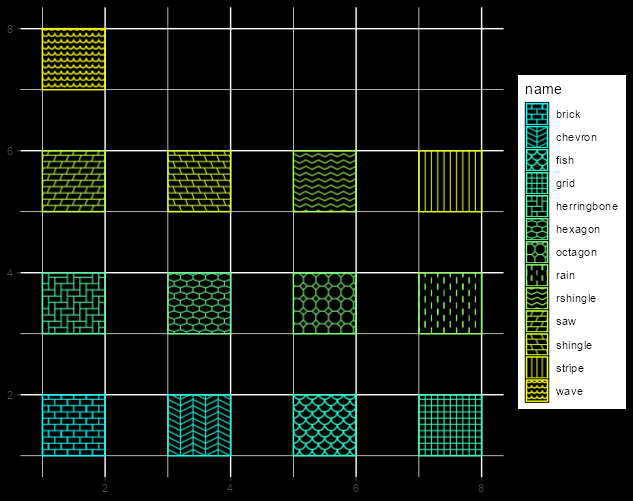
13種類のパターンは実行例の出力を確認してください。
パッケージのバージョンは1.0.2。windows 11のR version 4.4.1で確認しています。
パッケージのインストール
下記コマンドを実行してください。
# パッケージのインストール
install.packages("fillpattern")
実行コマンド
詳細はコメントやコマンドヘルプを確認してください。
# パッケージの読み込み
library("fillpattern")

###データ例の作成#####
# tidyverseパッケージがなければインストール
if(!require("tidyverse", quietly = TRUE)){
  install.packages("tidyverse");require("tidyverse")
}
# colorRampsパッケージがなければインストール
if(!require("colorRamps", quietly = TRUE)){
  install.packages("colorRamps");require("colorRamps")
}

# データの作成
TestData <- tibble(xmin = c(rep(c(1, 3, 5, 7), times = 3), 1),
                   xmax = c(rep(c(2, 4, 6, 8), times = 3), 2),
                   ymin = c(rep(c(1, 3, 5), each = 4), 7),
                   ymax = c(rep(c(2, 4, 6), each = 4), 8),
                   # 網掛け13種類
                   name = c("brick", "chevron", "fish",
                            "grid", "herringbone", "hexagon",
                            "octagon", "rain", "saw", "shingle",
                            "rshingle", "stripe", "wave"),
                   fill_col = c(colorRamps::cyan2yellow(13)))
########


# scale_fill_patternコマンドの使用例とオプション
ggplot(TestData, mapping = aes(xmin = xmin, xmax = xmax,
                               ymin = ymin, ymax = ymax,
                               color = name, fill = name)) +
  geom_rect() +
  scale_fill_pattern(
    # 網掛け13種類を設定:patternsオプション
    patterns = c("brick", "chevron", "fish",
                 "grid", "herringbone", "hexagon",
                 "octagon", "rain", "saw", "shingle",
                 "rshingle", "stripe", "wave"),
    # 角度を指定
    angle = 0,
    # 線種を指定;"solid","dashed","dotted","dotdash","longdash","twodash"
    lty = "solid",
    # 線の太さを指定
    lwd = 1) +
  scale_color_manual(values = TestData$fill_col) +
  theme(plot.background = element_rect(colour = "black", fill = "black"),
        panel.background = element_rect(colour = "black", fill = "black"))


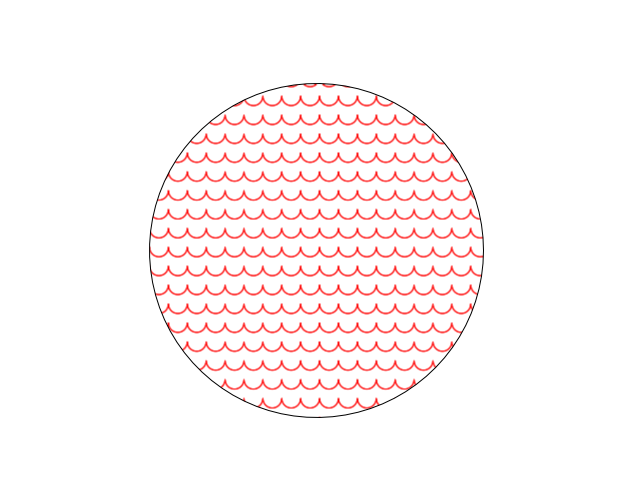
# 「grid」パッケージ:fill_patternコマンド
library("grid")
grid.newpage()
grid.circle(gp = gpar(fill = fill_pattern("wave", fg = "red")),
            x = 0.5, r = 1/3)


### その他参考例 #####
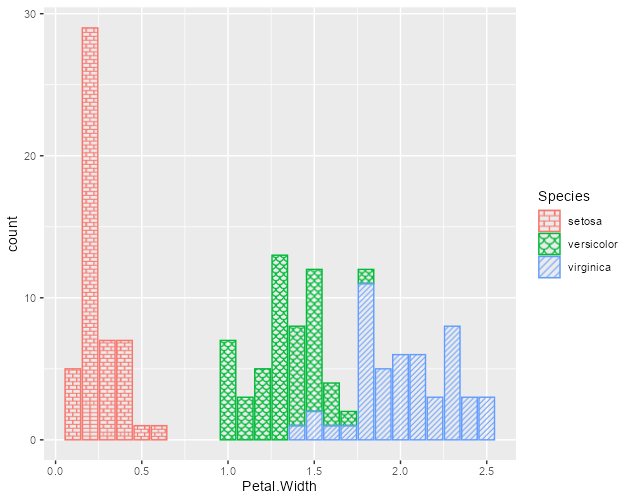
ggplot(iris, aes(x = Petal.Width, color = Species,
                 fill = Species), stat = "count") +
  geom_bar() +
  scale_fill_pattern()
########
実行例
・「ggplot2」パッケージ:scale_fill_patternコマンド
・「grid」パッケージ:fill_patternコマンド
・その他参考例
少しでも、あなたの解析が楽になりますように!!

