指定した色コードに基づき、補色、4色、色相(グラデーション)の色コードを出力してくれるパッケージです。
視覚で理解できるように色コードをrasterImageコマンドで描写する実行コマンドを紹介します。
なお、バージョンは1.0-1です。実行コマンドはwindows 11のR version 4.1.2で確認しています。非常にありがたいパッケージです。
パッケージのインストール
下記、コマンドを実行してください。
#パッケージのインストール
install.packages("ColorPalette", type = "source")
実行コマンドの紹介
詳細はコードのコメントをご覧ください。
#パッケージの読み込み
library("ColorPalette")
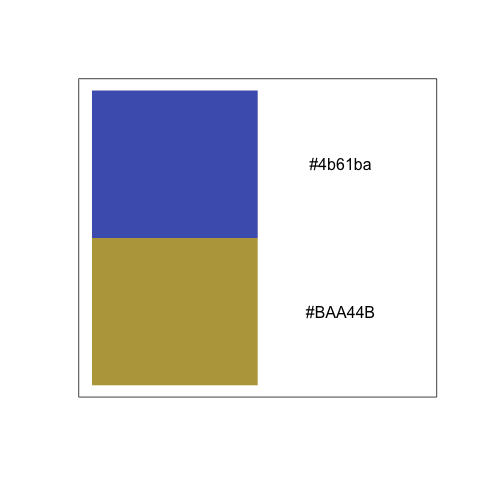
#指定した色を元に補色(正反対に位置なる色)でカウント分のカラーパレットを作ります
#正反対に位置なる色なので2色で識別しやすい色を生成します
CountCol <- 2
CColors <- complementColors("#4b61ba", count = CountCol)
plot(0:2, 0:2, type = "n", axes = FALSE, xlab = "", ylab = "")
box()
rasterImage(CColors,
0, 0, 1, 2, interpolate = FALSE)
text(x = 1.5, y = seq(1/CountCol, 2 - 1/CountCol, len = CountCol), rev(CColors))
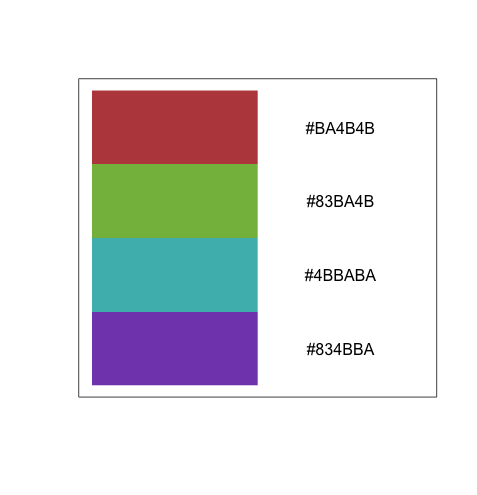
#指定した色を元に4色の組み合わせでカウント分のカラーパレットを作ります
CountCol <- 4
TColors <- tetradicColors("#4b61ba", count = CountCol)
plot(0:2, 0:2, type = "n", axes = FALSE, xlab = "", ylab = "")
box()
rasterImage(TColors,
0, 0, 1, 2, interpolate = FALSE)
text(x = 1.5, y = seq(1/CountCol, 2 - 1/CountCol, len = CountCol), rev(TColors))
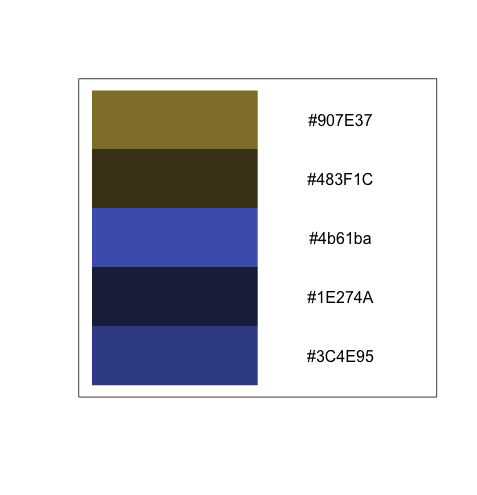
#指定した色を元にカウント分の色相(グラデーション)でカラーパレットを作ります
#カウント数を指定
CountCol <- 5
GMColors <- generateMonochromaticColors("#4b61ba", CountCol)
plot(0:2, 0:2, type = "n", axes = FALSE, xlab = "", ylab = "")
box()
rasterImage(GMColors,
0, 0, 1, 2, interpolate = FALSE)
text(x = 1.5, y = seq(1/CountCol, 2 - 1/CountCol, len = CountCol), rev(GMColors))出力例
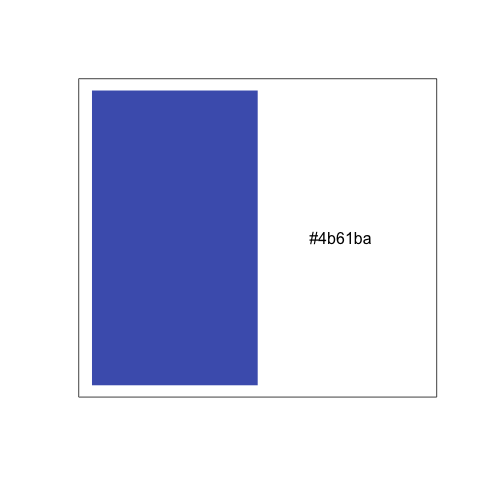
パレット横の数字はカラーコードです。
<ベースの色>
<complementColors>
<tetradicColors>
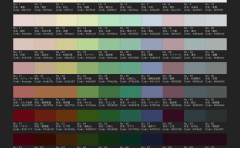
<generateMonochromaticColors>
少しでも、あなたのウェブや実験の解析が楽になりますように!!