RAnalytics

RAnalytics

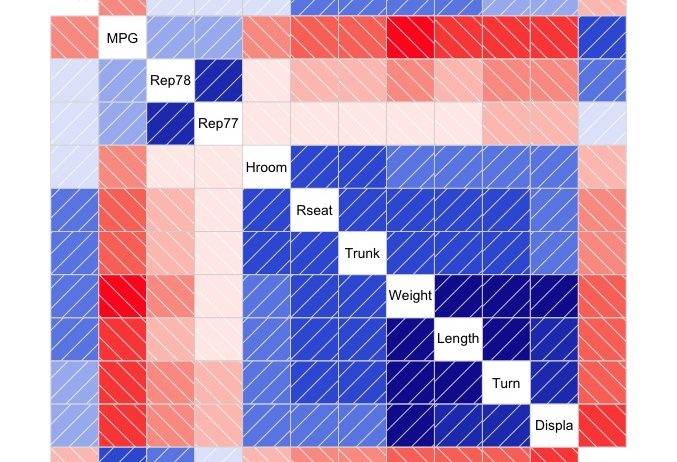
Analysis in R:I can see the relationship between indicators! The “corragram” package

Methods to show the relationship between indicators include scatter plots and correlation coefficien...
RAnalytics

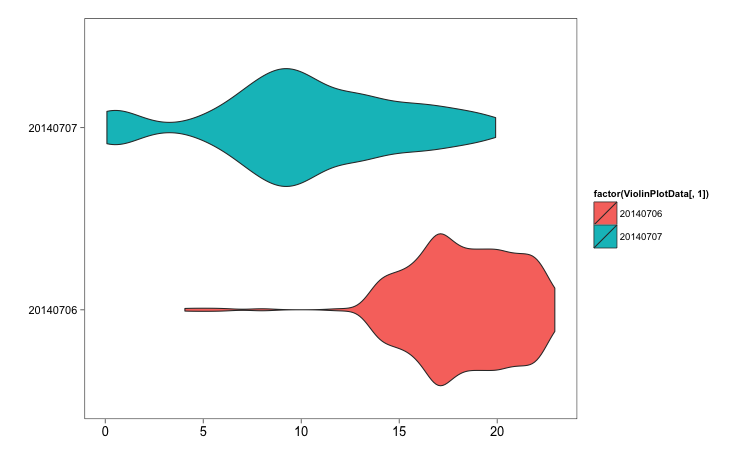
Analysis in R: Intuitive understanding of trends! Creating Violin Plots with ggplot2

There are a number of charts that show trends in access, including bar charts, line charts, and, onc...
RAnalytics

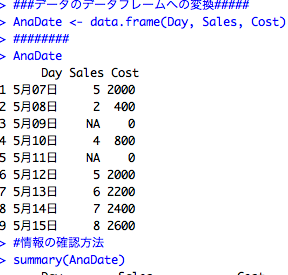
Analysis in R: Commands related to data frames

The use of R for web analysis is growing, but I think it is not yet widespread. This section introdu...
スポンサーリンク
RAnalytics

Analysis in R: Basic commands for manipulating data

Many of you may use Excel to analyze data, but using R may reveal facts that Excel could not. We enc...
RAnalytics

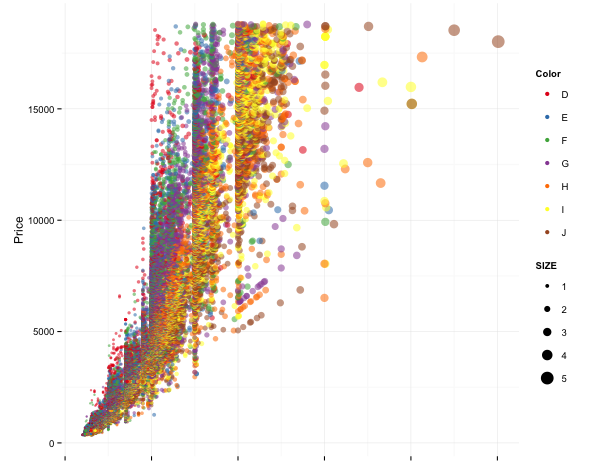
Analysis in R: If you want simple and clean graphs, here is a summary of ggplot2

The ggplot2 package is a very powerful plotting package. We have compiled a list of uses and command...
RAnalytics

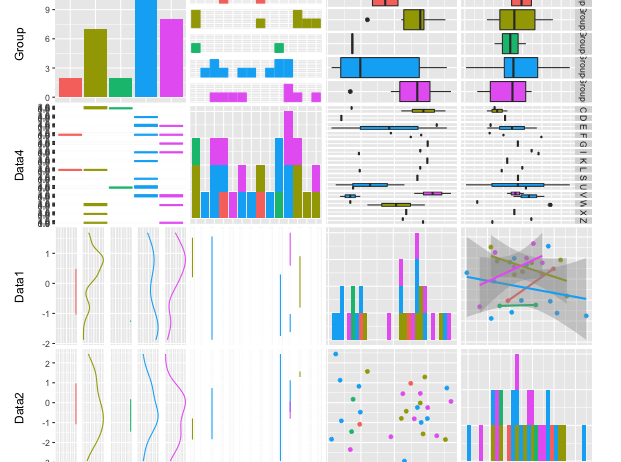
Analysis in R: Check data properties at once. “GGally” package

This is an introduction to a package for plotting multivariate characteristics. I find this package ...
RAnalytics

Analysis in R:Adding information to ggplot2!! The “ggpp” package

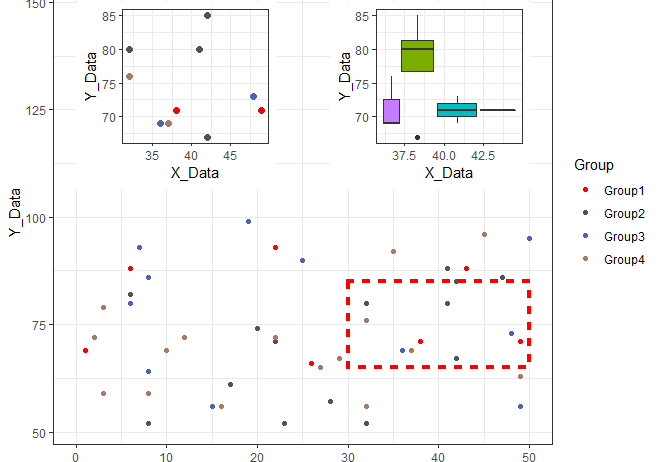
This is an introduction to a package that is useful for adding plots, text, and other information to...
RAnalytics

Analysis in R: Different Colors, Different Colors, Different Colors! The “randomcoloR” package

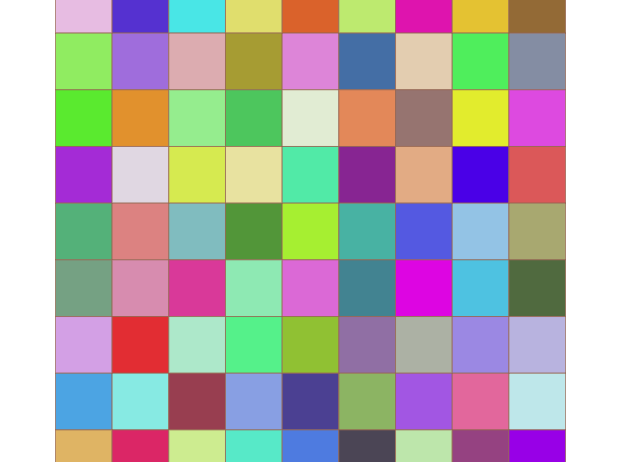
Color not only affects the quality of materials, but is also profound, expressing feelings such as l...
RAnalytics

Analysis in R: Create Heat Maps Easily! The “heatmap3” package

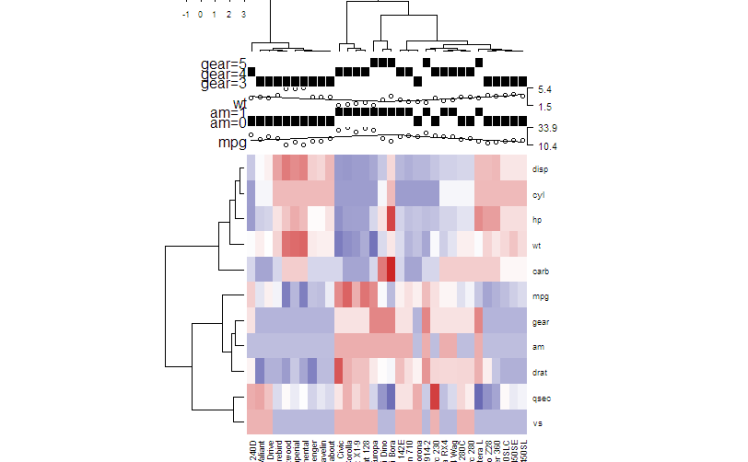
Heatmap is a way to visually display the size of numbers and objects by color.Note that the ggplot2 ...
RAnalytics

Analysis in R: Why don’t you output your tables to a file, etc.? The “stargazer” package

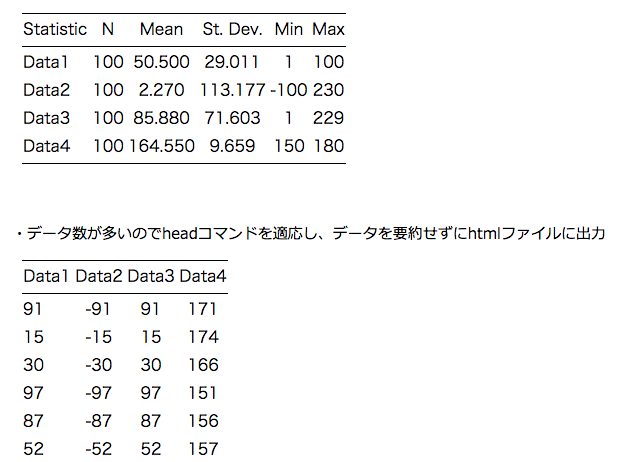
The "stargazer" package has a long history of version upgrades since its release in 2012. This packa...
スポンサーリンク