RAnalytics

RAnalytics

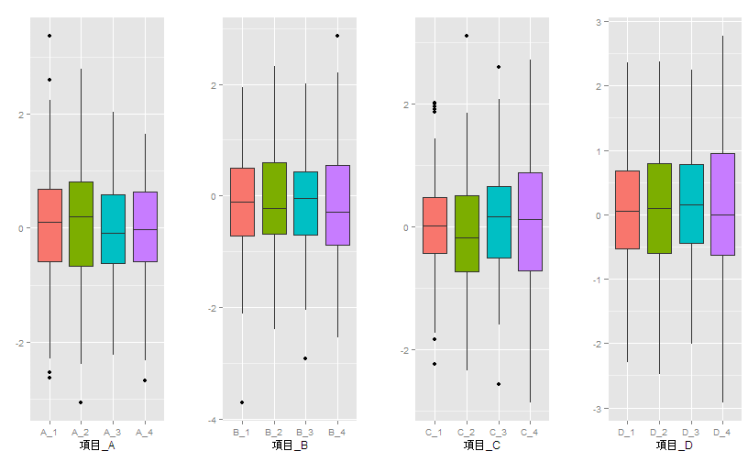
Analysis in R: ggplot2 made easy! The “ggpubr” package

Although ggplot2 is a useful package for plotting data, sometimes the procedures for doing so can be...
RAnalytics

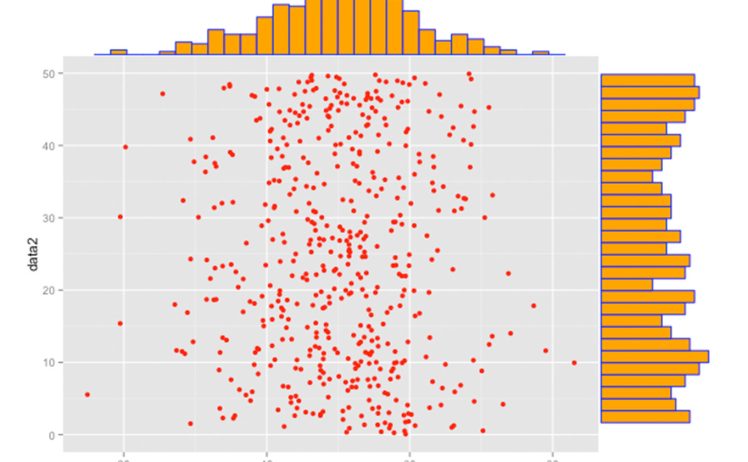
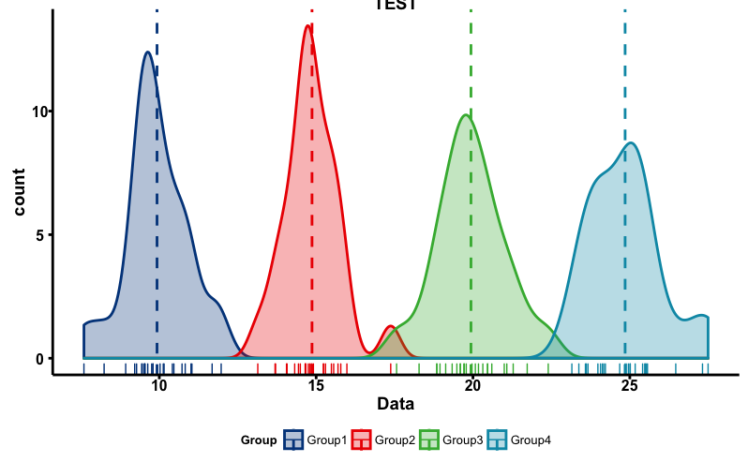
Analysis in R: Simple!! Plotting marginal distributions. ggplot2 extension “ggExtra” package

Plotting marginal distributions on a graph is quite time-consuming, so we introduce the "ggExtra pac...
RAnalytics

Analysis in R: Introduction to Probability Distribution Commands

This section introduces commands for the normal, binomial, chi-square, and F distributions. Command ...
スポンサーリンク
RAnalytics

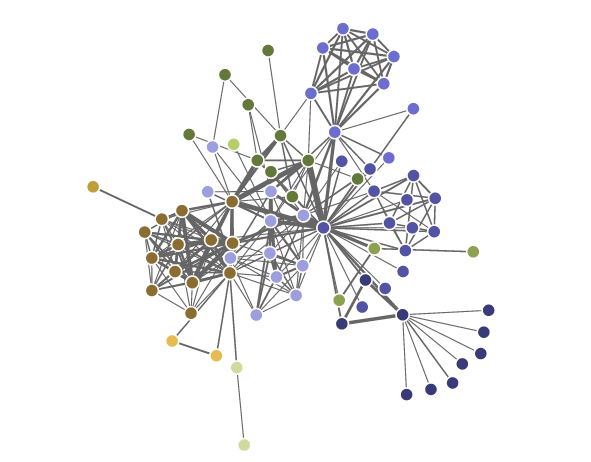
Analysis in R: Interactive Network Diagrams! The “networkD3” package

Introducing "networkD3" package, which allows you to manipulate network diagrams interactively. It i...
RAnalytics

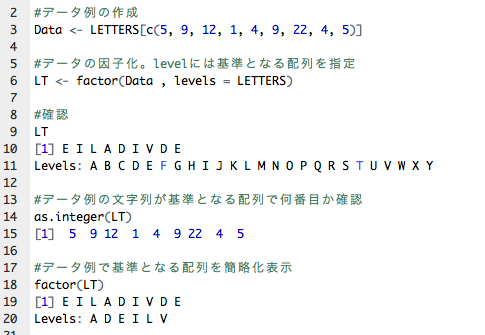
Analysis in R: Manipulating Factor! About Factor

When manipulating data in R, you may create a vector or data frame data whose class is factor. If yo...
RAnalytics

Analysis in R: Venn diagrams made easy! “VennDiagram” package

Venn diagrams are useful for interpreting data, and there are many ways to create Venn diagrams in R...
RAnalytics

Analysis in R: Repeat the process with the element name in the data frame.

While row-by-row or column-by-column processing can be handled with the "apply", "lapply", or "suppl...
RAnalytics

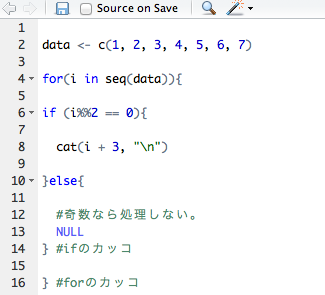
Analysis in R: Iteration and conditional decision commands

The R operation combines commands to process data and output results. In many cases there is rarely ...
RAnalytics

Analysis in R: Useful! xml files to read in R

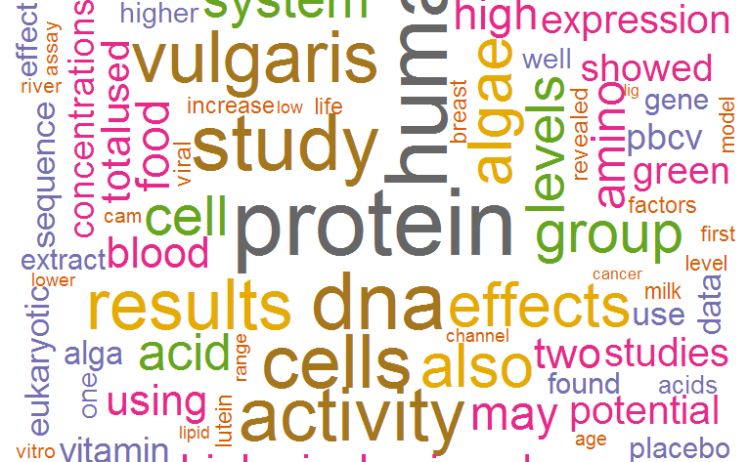
PubMed is a literature search site that outputs search results in xml format. xml can be edited in R...
RAnalytics

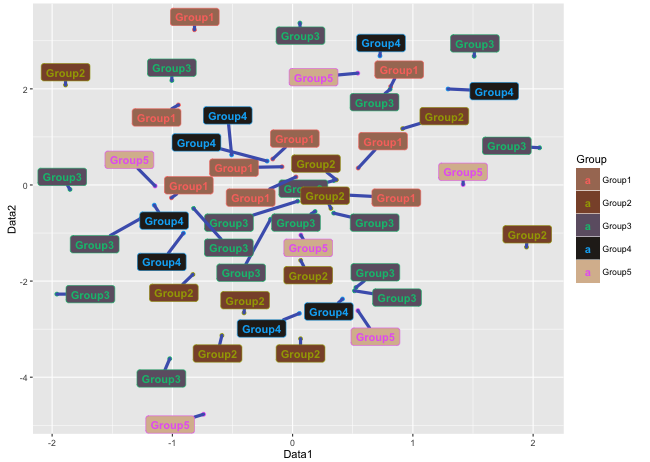
Analysis in R: “ggrepel” package useful for adding text and labels to geom_point

The ggplot2 package has a geom_point command that is useful for creating scatter plots, but it was v...
スポンサーリンク