The use of R for web analysis is growing, but I think it is not yet widespread. This section introduces commands related to R data frames that are useful to those considering using R for web analysis. Once you have a handle on data frame operations, you will be able to perform more advanced tasks.
The following data is an example.
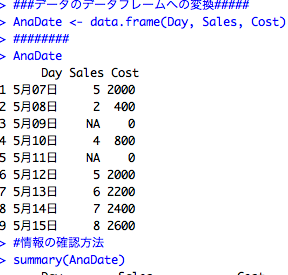
###Creating Data Examples#####
Day <- c("5月07日", "5月08日", "5月09日", "5月10日", "5月11日",
"5月12日", "5月13日", "5月14日", "5月15日")
Sales <- c(5, 2, NA, 4, NA, 5, 6, 7, 8)
Cost <- c(2000, 400, 0, 800, 0, 2000, 2200, 2400, 2600)
########
###Conversion of data into data frames#####
AnaDate <- data.frame(Day, Sales, Cost)
########
AnaDate
Day Sales Cost
1 5月07日 5 2000
2 5月08日 2 400
3 5月09日 NA 0
4 5月10日 4 800
5 5月11日 NA 0
6 5月12日 5 2000
7 5月13日 6 2200
8 5月14日 7 2400
9 5月15日 8 2600Introduction of data frame processing functions
Check data contents: summary
summary(AnaDate)

      Day        Sales            Cost
 5月07日:1   Min.   :2.000   Min.   :   0
 5月08日:1   1st Qu.:4.500   1st Qu.: 400
 5月09日:1   Median :5.000   Median :2000
 5月10日:1   Mean   :5.286   Mean   :1378
 5月11日:1   3rd Qu.:6.500   3rd Qu.:2200
 5月12日:1   Max.   :8.000   Max.   :2600
 (Other):3   NA's   :2
Check the number of missing values in the data: sum of totals and is.na for NA value check
sum(is.na(AnaDate))

 [1] 2

#It indicates that there are two missing values in the data.
Reference to specified row or column: parenthesis operator [i, j].
*i is the column and j is the row.
Extract the second row of data.
AnaDate[complete.cases(AnaDate), ]

   Day  Sales Cost
1 5月07日  5  2000
2 5月08日  2   400
4 5月10日   4    800
6 5月12日   5   2000
7 5月13日   6   2200
8 5月14日   7   2400
9 5月15日   8   2600

Data will be displayed with columns 3 and 5 containing missing values deleted.
Merge data frames: rbind for horizontal merging and cbind for vertical merging
rbind(AnaDate, AnaDate)

     Day  Sales Cost
1  5月07日     5 2000
2  5月08日     2  400
3  5月09日    NA    0
4  5月10日     4  800
5  5月11日    NA    0
6  5月12日     5 2000
7  5月13日     6 2200
8  5月14日     7 2400
9  5月15日     8 2600
10 5月07日     5 2000
11 5月08日     2  400
12 5月09日    NA    0
13 5月10日     4  800
14 5月11日    NA    0
15 5月12日     5 2000
16 5月13日     6 2200
17 5月14日     7 2400
18 5月15日     8 2600

cbind(AnaDate, AnaDate)

  Day Sales Cost Day   Sales Cost
1 5月07日 5 2000 5月07日 5   2000
2 5月08日 2  400 5月08日 2    400
3 5月09日 NA   0 5月09日 NA     0
4 5月10日 4  800 5月10日 4    800
5 5月11日 NA   0 5月11日 NA     0
6 5月12日 5 2000 5月12日 5   2000
7 5月13日 6 2200 5月13日 6   2200
8 5月14日 7 2400 5月14日 7   2400
9 5月15日 8 2600 5月15日 8   2600
Batch processing for rows or columns: apply command
Changing the mean in the function allows for different processing. In the example, the average is calculated.
#Processing for columns
apply(AnaDate[, 2:ncol(AnaDate)], 1, mean, na.rm=TRUE)
[1] 1002.5  201.0    0.0  402.0    0.0 1002.5 1103.0 1203.5 1304.0

#Processing for rows
apply(AnaDate[, 2:ncol(AnaDate)], 2, mean, na.rm=TRUE)
      Sales        Cost
   5.285714 1377.777778
I hope this makes your analysis a little easier !!