While row-by-row or column-by-column processing can be handled with the “apply”, “lapply”, or “supply” commands, there are times when you may want to iterate through the names of items in a data frame.

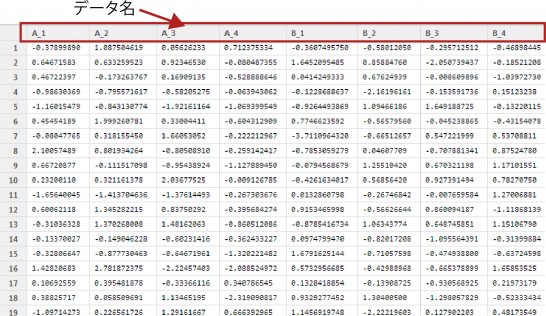
For example, data for several items observed several times at different times.
“Item X_1, Item X_2, Item X_3, Item Y_1, Item Y_2, Item Y_3…”
Here is an example of code that processes data item by item.
Packages required to run the code
Run the following command.
install.packages(c("ggplot2", "grid", "reshape"))Points to be processed item by item
The format of SampleData is a data frame; SampleData should be modified as required.
###Prepare for iterative processing and label vector creation########
CNAnaData <- t(as.data.frame(strsplit(colnames(SampleData),"_")))[, 1] #Get the name of the column identified by an underscore.
StartCol <- (which( duplicated(CNAnaData) == TRUE, arr.ind = TRUE)[1]) - 1 #Get Start Row
RangeCol <- unique(rle(CNAnaData)[[1]][rle(CNAnaData)[[1]] != 1]) #Get End Column
LabName <- unique(CNAnaData) #Get labels
########

###Set iteration vectors########
StartColSelect <- seq(StartCol, (ncol(SampleData)), by = RangeCol) #Creation of measured start vectors
EndColSelect <- seq(StartCol + (RangeCol - 1), (ncol(SampleData)), by = RangeCol) #Creation of measured end vectors
########
Reference example: Code to plot BoxPlot by element name
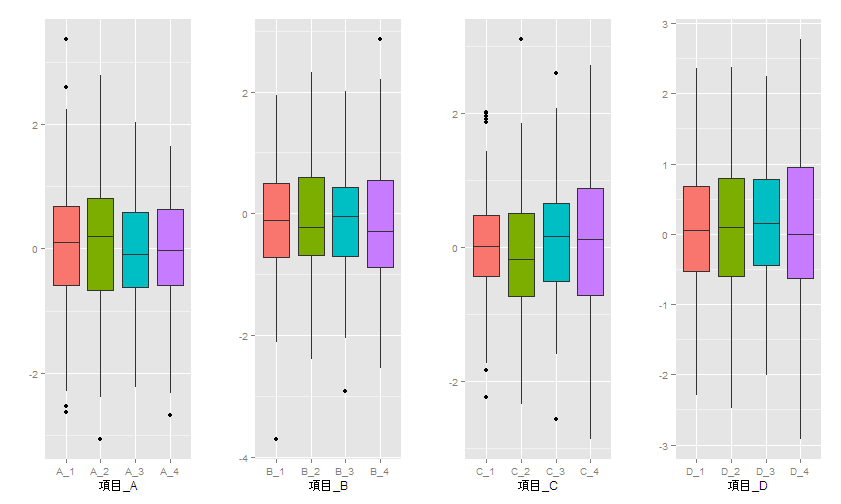
The following code will plot a box plot for each element name.
As the ID is not specified in the merge function, “Use as id variables” is displayed, but this is not a problem.
library("ggplot2")
library("grid") #Need to adjust layout
library("reshape") #Required to use Meld

###Creation of sample data#####
Item <- 4 #Set number of items, 4 for now
Rep <- 4 #Number of repetitions per item, 4 for now
DataVol <- 100 #Set the number of columns, 100 for now
ColNames <- NULL

#Creating a column name
for (i in seq(Item)){
  name <- paste(LETTERS[i], "_", 1:Rep, sep="")
  ColNames <- c(ColNames, name)
}

SampleData <- as.data.frame(matrix(rnorm(DataVol * Item * Rep), nr = DataVol, nc = Item * Rep))
colnames(SampleData) <- ColNames #Set column name
########

###Prepare for iterative processing and label vector creation########
CNAnaData <- t(as.data.frame(strsplit(colnames(SampleData),"_")))[, 1]
StartCol <- (which( duplicated(CNAnaData) == TRUE, arr.ind = TRUE)[1]) - 1
RangeCol <- unique(rle(CNAnaData)[[1]][rle(CNAnaData)[[1]] != 1])
LabName <- unique(CNAnaData)
########

###Set iteration vectors########
StartColSelect <- seq(StartCol, (ncol(SampleData)), by = RangeCol)
EndColSelect <- seq(StartCol + (RangeCol - 1), (ncol(SampleData)), by = RangeCol)
########

###Layout Settings#####
grid.newpage()
gl <- grid.layout(nrow = 1, ncol = 4) #Layout divided by 1*4
pushViewport(viewport(layout=gl))
#grid.show.layout(gl) #Confirmation of layout
########

###Repeated plots with repeated processing vectors#####

for(n in seq(StartColSelect)){

  meltAnaData <- melt(SampleData[, StartColSelect[n]:EndColSelect[n]])

  ###ggplot2#####
  plotdata <- ggplot(meltAnaData, aes(x = meltAnaData[, 1],
                                         y = meltAnaData[, 2],
                                         fill = meltAnaData[, 1]))
  PlotData <- plotdata +
    geom_boxplot(size = 0.1, show_guide = FALSE) +
    labs(x = paste("Item_", LabName[n], sep = ""), y = "")

  print(PlotData, vp = viewport(layout.pos.col = n))
}
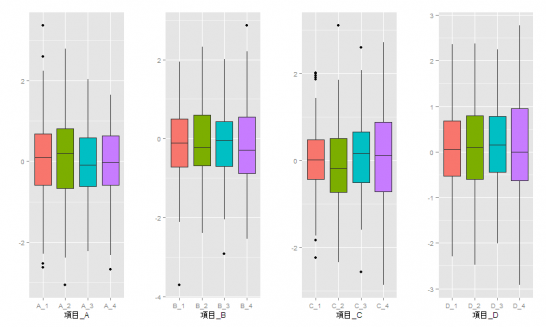
Output Examples
As the “rnorm” command is used to create the data, the data changes each time.

I hope this makes your analysis a little easier !!


