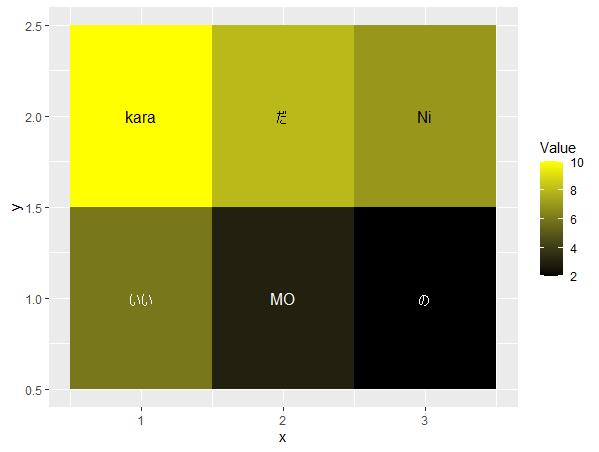
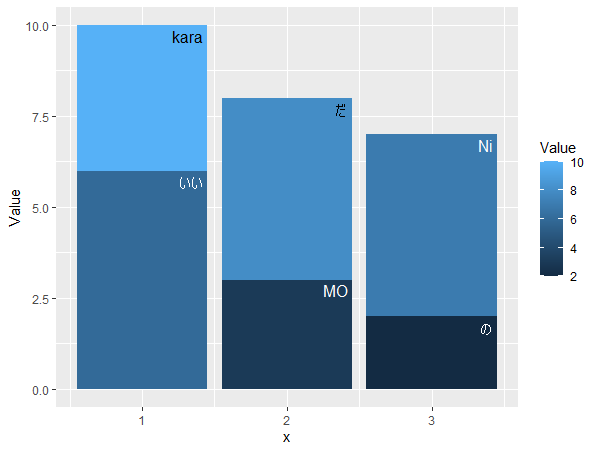
This is an introduction to the ggplot2 package, which is useful for plotting text within a graph area. It automatically adjusts the text size to fit perfectly within the area. It can have many uses.
Package version is 0.9.1. Checked with R version 4.2.2.
Install Package
Run the following command.
#Install Package
install.packages("ggfittext")
Example
See the command and package help for details.
#Loading the library
library("ggfittext")

###Creating Data#####
#tInstall the tidyverse package if it is not already there
if(!require("tidyverse", quietly = TRUE)){
  install.packages("tidyverse");require("tidyverse")
}
tibble(Text = c("kara", "だ", "Ni", "いい", "MO", "の"),
       Value = sample(1:10, 6),
       x = rep(1:3, 2),
       y = rep(2:1, each = 3)) -> TestData
########

#Character fit plotting: geom_fit_text command, geom_bar_text command
#Center alignment:reflow = TRUE/FALSE
#Enlarge/reduce text to fit the area:grow = TRUE/FALSE
#Font position:place = "top", "topright", "right", "bottomright", "bottom", "bottomleft"
#Automatic adjustment of text color:contrast = TRUE/FALSE

#Example 1:grow = TRUE
ggplot(TestData, aes(x = x, y = y, fill = Value, label = Text)) +
  geom_tile() +
  scale_fill_gradient(low = "black", high = "yellow") +
  geom_fit_text(reflow = TRUE, grow = TRUE, contrast = TRUE)

#Example 2:grow = FALSE
ggplot(TestData, aes(x = x, y = y, fill = Value, label = Text)) +
  geom_tile() +
  scale_fill_gradient(low = "black", high = "yellow") +
  geom_fit_text(reflow = TRUE, grow = FALSE, contrast = TRUE)

#Example 3:grow = TRUE
ggplot(TestData, aes(x = x, y = Value, fill = Value, label = Text)) +
  geom_col(position = "dodge") +
  geom_bar_text(reflow = FALSE, grow = TRUE,
                contrast = TRUE, place = "topright")

#Example 4:grow = FALSE
ggplot(TestData, aes(x = x, y = Value, fill = Value, label = Text)) +
  geom_col(position = "dodge") +
  geom_bar_text(reflow = FALSE, grow = FALSE,
                contrast = TRUE, place = "topright")
Output Example
・Example1:grow = TRUE

・Example2:grow = FALSE

・Example3:grow = TRUE

・Example4:grow = FALSE

I hope this makes your analysis a little easier !!


