Discriminant analysis (pattern analysis) is one of the methods used to explore the characteristics of collected data by determining grouping rules from the “characteristics (variables)” possessed by each individual and estimating the group to which an unknown individual belongs.
For example, discriminant analysis is used to “estimate which type of flower is already known based on its characteristics,” “estimate any credit rating based on a company’s financial performance,” “estimate the author of an unnamed novel based on word appearance trends,” and “estimate behavioral patterns that lead to purchases on the Web.
Although it is a useful discriminant analysis, I have not seen many R packages that output figures that can be used in presentation materials without further processing. Therefore, it’s present the “PPtreeViz” package, which can solve such problems.
Package version is 2.4.0. Checked with R version 4.2.2.
Install Package
Run the following command.
install.packages("PPtreeViz")Example
See the comments in the command and the package’s help file for details.
For the classification rules, the “PPmethod” option is used, and the algorithms “LDA”, “PDA”, “Lr”, “GINI”, and “ENTROPY” are available. The reference data are the “iris” data supplied with R.
#Loading the library
library("PPtreeViz")

#Loading the data
data(iris)

#Example 1
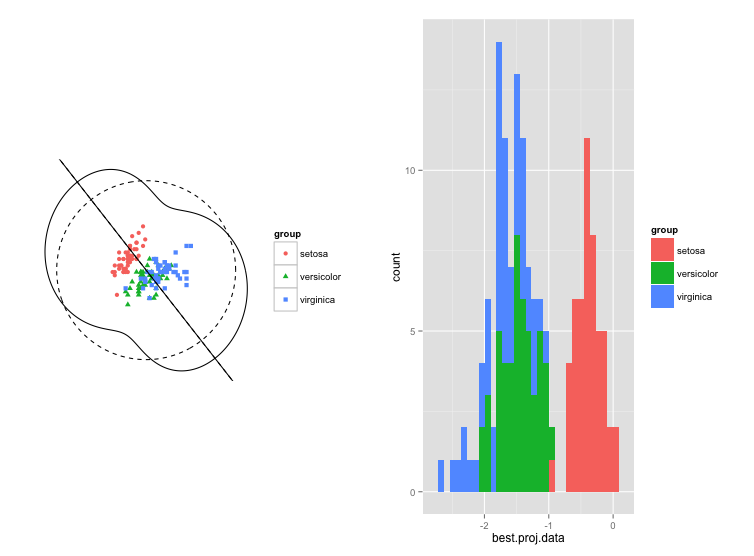
Huberplot(iris[,1:2], iris[,5], PPmethod = "LDA")

#Example 2
LDAindex(iris[,5],as.matrix(iris[,1:4]))

#Example 3
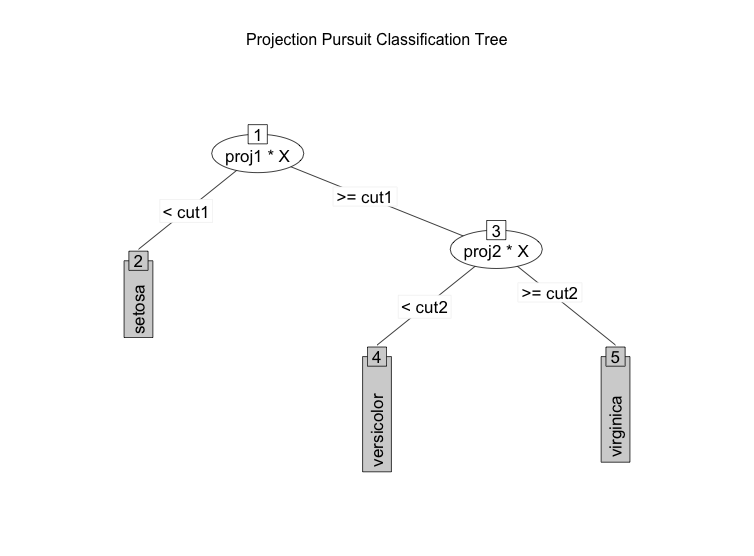
Tree.result <- PPTreeclass(Species~., data = iris, PPmethod = "LDA")
Tree.result
plot(Tree.result)

#Example 4
Tree.result <- PPTreeclass(Species~., data = iris, PPmethod = "LDA")
Tree.result
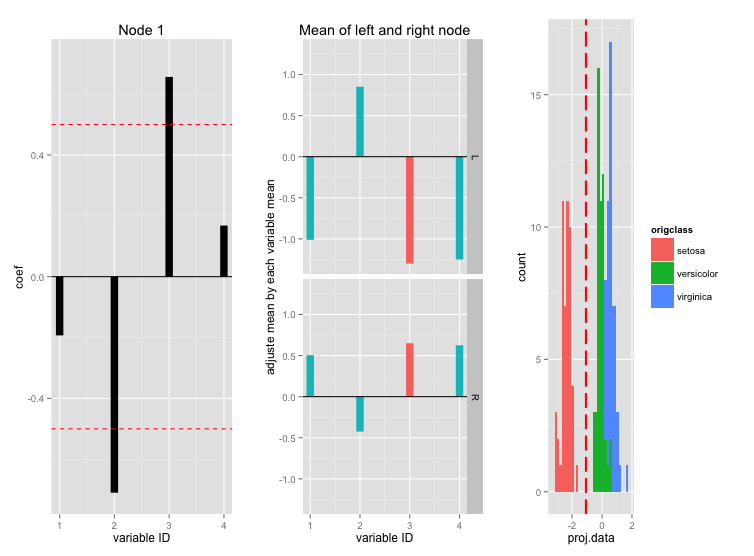
PPclassNodeViz(Tree.result,1,1)
Output Example
Example1
Example 3
Example 4
I hope this makes your analysis a little easier !!

