I would like to introduce the “threejs” package, which allows you to create 3D scatter plots that can be moved around. Scatter plots are a very effective way to explore the characteristics of data.
Although it is possible to create interactive 3D ScatterPlots with other packages, this package is unique in that it allows you to import an image and easily create an interactive sphere plot for each image.
Package version is 0.3.3.
Install Package
Run the following command.
install.packages("threejs")Examples
See the command and package help for details.
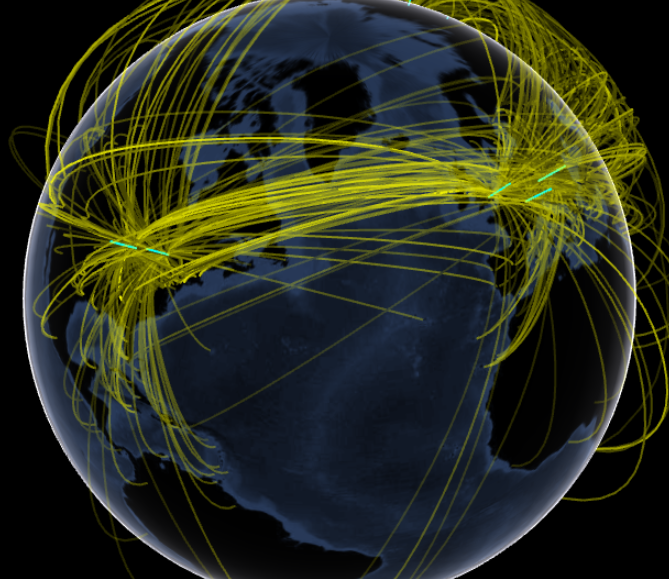
Below are examples of loading an image of the Earth and plotting the flight data provided with the package (Example 1), and creating a pseudo data and plotting a 3D scatterplot (Example 2).
#Loading the library
library("threejs")

#Examples 1
#Loading package-attached data
data(flights)

#Shaping of data coordinates
dest <- factor(sprintf("\\%.2f:\\%.2f",flights[,3], flights[,4]))

#Sorting Data
freq <- sort(table(dest), decreasing = TRUE)

#TOP 10 hub airports
frequent_destinations <- names(freq)[1:10]
idx <- dest %in% frequent_destinations

#Get departure and arrival coordinates
frequent_flights <- flights[idx, ]

#Unify data
latlong <- unique(frequent_flights[,3:4])

#Plot
#If the world is set to the moon, an image of the moon can be used.
#Photos of Jupiter and Mars are included.
earth <- system.file("images/world.jpg", package = "threejs")
globejs(img = earth, lat = latlong[,1], long = latlong[,2], arcs = frequent_flights,
        arcsHeight = 0.3, arcsLwd = 2, arcsColor = "#ffff00", arcsOpacity = 0.15,
        atmosphere = TRUE)

#Examples 2
#Creating Data
i <- sample(3, 50, replace = TRUE)
x <- matrix(rnorm(50*3),ncol=3)

#Plot label
lab <- c("small", "bigger", "biggest")

#Plot
scatterplot3js(x, color = rainbow(50), labels = lab[i], size = i)
Output Examples
Examples 1
クリックすると大きく表示されます。
I hope this makes your analysis a little easier !!


