ggplot2

RAnalytics

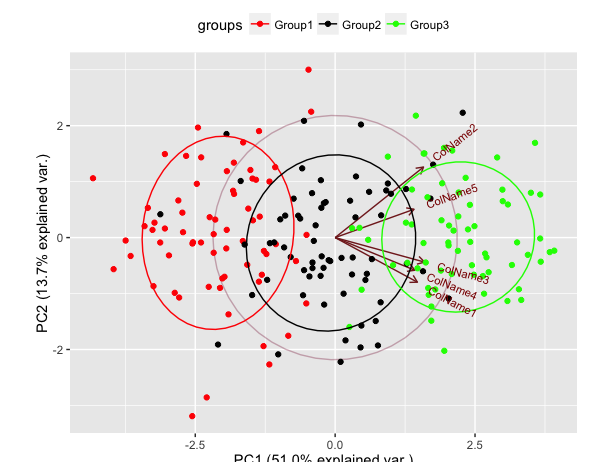
Analysis in R: PCA results in ggplot2 displayed in Biplot “ggbiplot” package

This is an introduction to the ggplot2 package for displaying the results of a principal component a...
RAnalytics

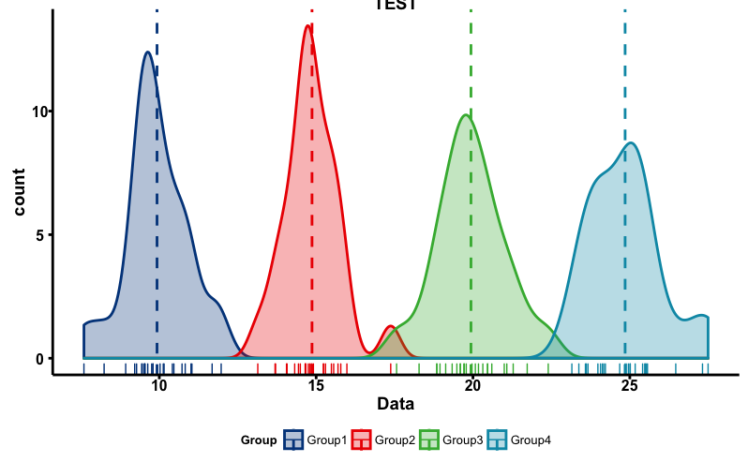
Analysis in R: ggplot2 made easy! The “ggpubr” package

Although ggplot2 is a useful package for plotting data, sometimes the procedures for doing so can be...
RAnalytics

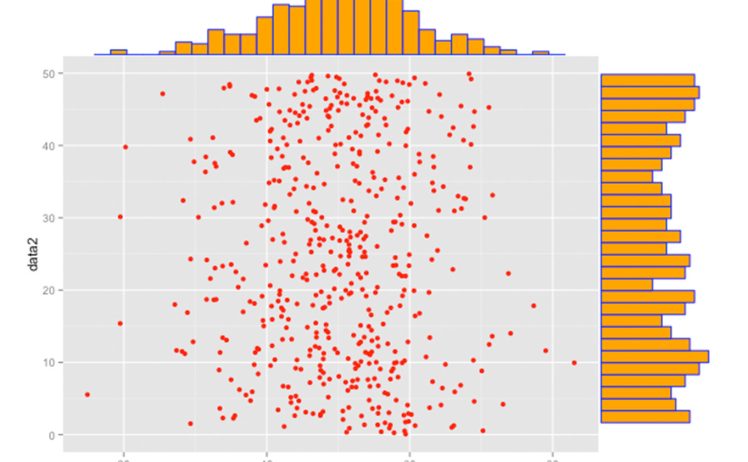
Analysis in R: Simple!! Plotting marginal distributions. ggplot2 extension “ggExtra” package

Plotting marginal distributions on a graph is quite time-consuming, so we introduce the "ggExtra pac...
RAnalytics

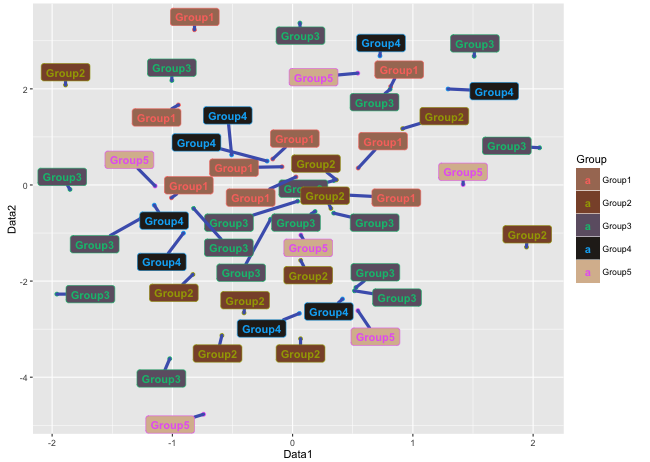
Analysis in R: “ggrepel” package useful for adding text and labels to geom_point

The ggplot2 package has a geom_point command that is useful for creating scatter plots, but it was v...
RAnalytics

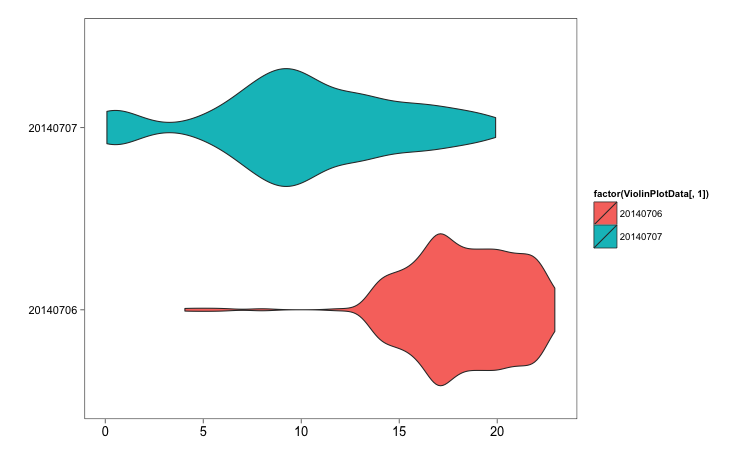
Analysis in R: Intuitive understanding of trends! Creating Violin Plots with ggplot2

There are a number of charts that show trends in access, including bar charts, line charts, and, onc...
RAnalytics

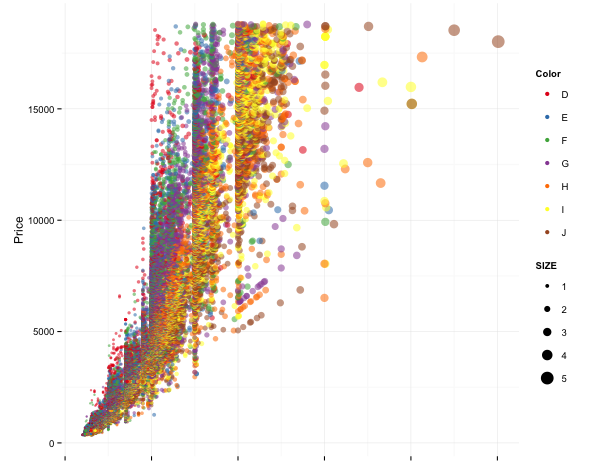
Analysis in R: If you want simple and clean graphs, here is a summary of ggplot2

The ggplot2 package is a very powerful plotting package. We have compiled a list of uses and command...
RAnalytics

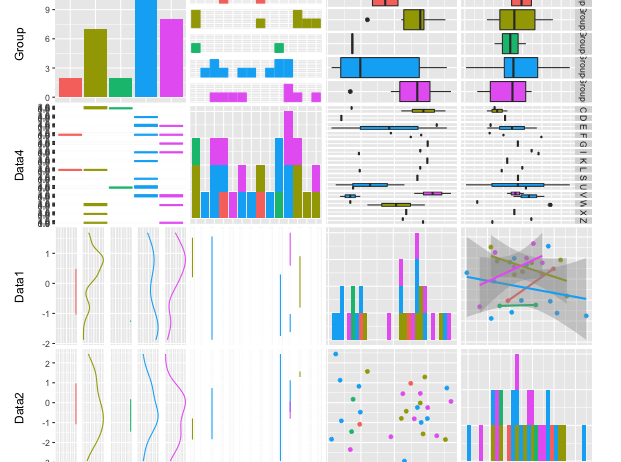
Analysis in R: Check data properties at once. “GGally” package

This is an introduction to a package for plotting multivariate characteristics. I find this package ...
スポンサーリンク