Interactive

RAnalytics

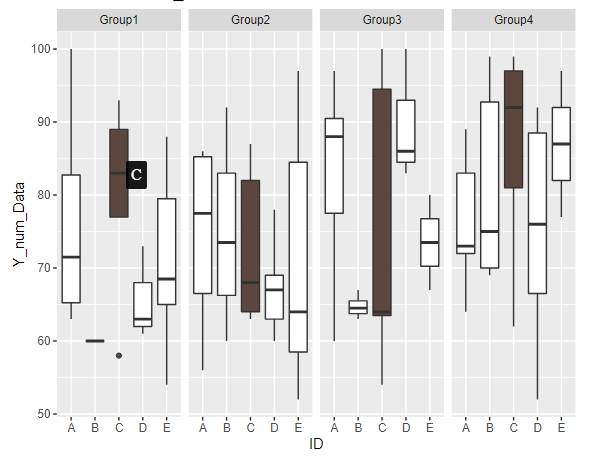
Analysis in R: ggplot2 interactive! The “ggiraph” package

This package makes the graphs in the "ggplot2" package interactive. The example shows the "ggom_poin...
RAnalytics

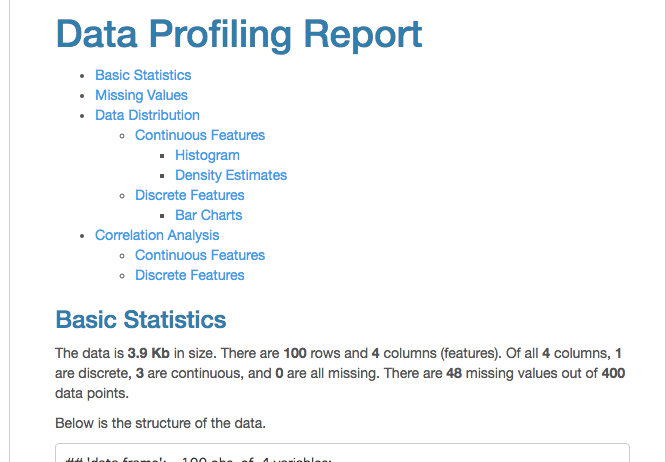
Analysis in R: ‘DataExplorer’ package for a simple browser view of data content

This package allows you to easily check the data content in a browser. It is also possible to check ...
RAnalytics

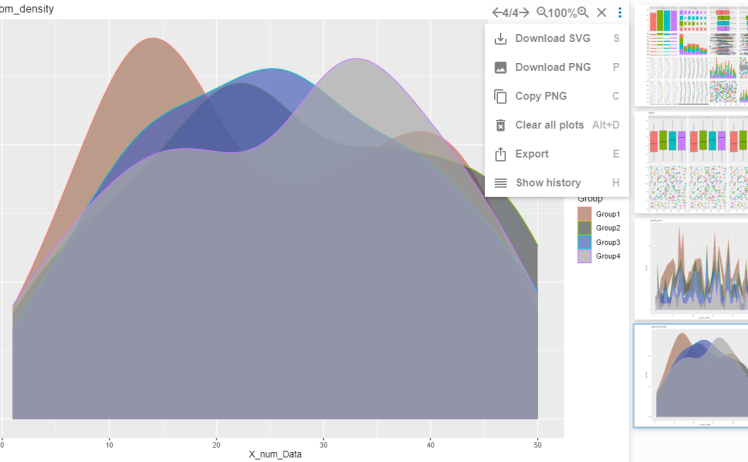
Analysis in R: managing plots in the browser. The “httpgd” package

This package allows plots to be managed in a browser or RStudio's viewer. The operations that can be...
RAnalytics

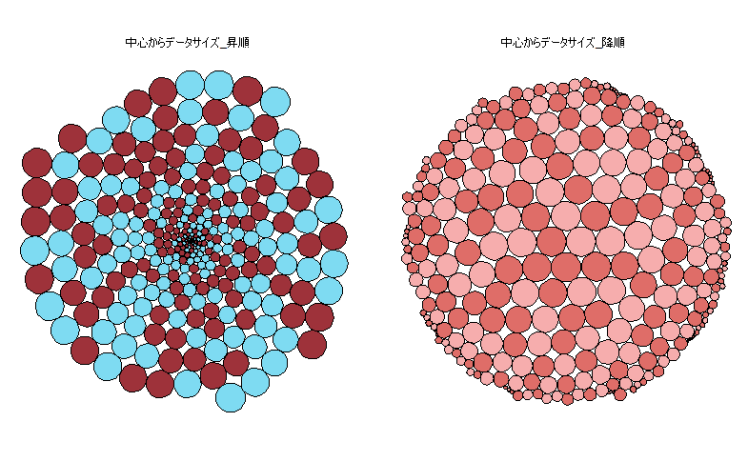
Analysis in R: Representing data features as circles. The “packcircles” package

This is an introduction to a package that displays the characteristics of data as a circle. Note tha...
RAnalytics

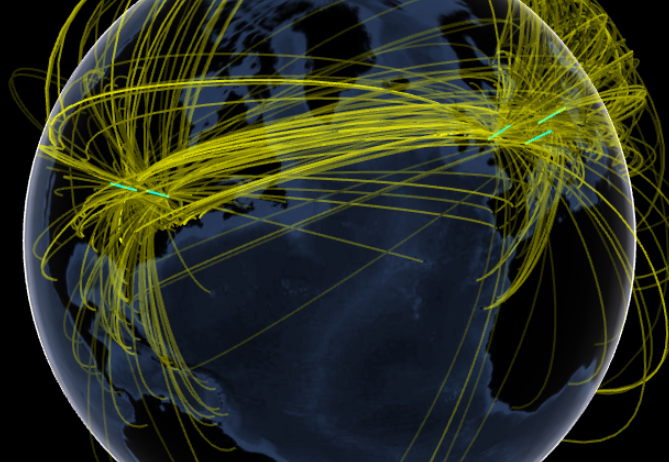
Analysis in R: Creating a 3D ScatterPlot “threejs” package!

I would like to introduce the "threejs" package, which allows you to create 3D scatter plots that ca...
RAnalytics

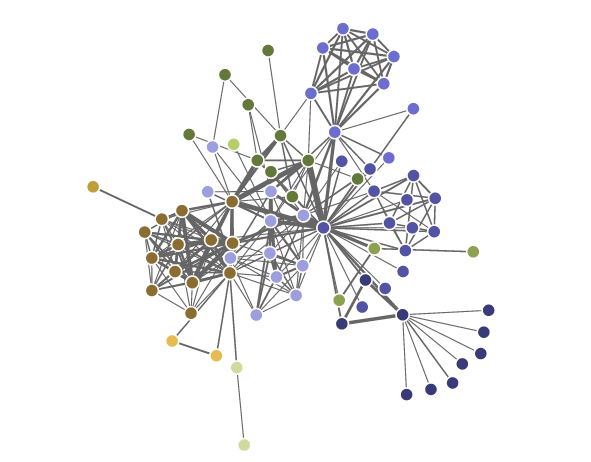
Analysis in R: Interactive Network Diagrams! The “networkD3” package

Introducing "networkD3" package, which allows you to manipulate network diagrams interactively. It i...
スポンサーリンク